2020 U.S. PET FOOD SPENDING $36.84B…Up ↑$5.65B
The Pandemic of 2020 caused much turmoil in the retail marketplace. The Pet Industry grew but the results by segment were mixed. Total spending reached $83.74B, up $5.31B (+6.8%). Food saw panic binge buying in the 1st half. It slowed slightly in the 2nd half, but spending was still strong. The other necessary segment, Veterinary, also had double digit growth. The 2 discretionary segments, Supplies and especially Services were hit hard. Here are the specifics:
- Pet Food – $36.84B; Up $5.65B (+18.1%)
- Pets & Supplies – $15.16B; Down $1.65B (-9.8%)
- Veterinary – $24.85B; Up $3.05B (+14.0%)
- Pet Services – $6.89B; Down $1.73B (-20.1%)
The industry truly is a “sum” of its integral segments, and each segment has very specific and often very different buying behavior from the many consumer demographic segments. For this reason, we’re going to analyze each of the industry segments first. This will put the final analysis of Total Pet Spending into better perspective. Note: The numbers in this report come from or are calculated by using data from the current and past US BLS Consumer Expenditure Surveys. In 2020, this was gathered by the U.S. Census Bureau from over 42,000 interviews and spending diaries. The final data was then compiled and published by the US BLS.
We will start with the largest Segment, Pet Food (and Treats). In 2020 Pet Food Spending totaled $36.84B in the U.S., a $5.65B (+18.1%) increase from 2019. This was the largest increase in history. It’s interesting that 4 of the 5 greatest $ increases and the 2 biggest $ decreases have all occurred in the last 6 years. The current trend in high priced, super premium foods magnifies the results of any changes in consumer purchasing behavior. In earlier research we discovered a distinct, long term pattern in Pet Food Spending. In 2018 we broke the pattern due to outside influences – 1st the FDA warning, then with COVID in 2020. Here is Pet Food Spending since 1997 in full Retail Dollars and adjusted for inflation.

The pattern began in 1997. Retail Pet Food Spending increases for 2 consecutive years then reaches a plateau year or even drops. There was a notable exception in the period from 2006 to 2010. During this time, there were two traumas which directly impacted the Pet Food Retail market. The first was the Melamine recall, which resulted in radically increased prices as consumers insisted on made in USA products with all USA ingredients. The second affected everyone – the great Recession in 2009. This was the first time that annual U.S. retail spending had declined since 1956. The net result was that the plateau period was extended to include both 2009 and 2010.
For 20 years, Pet Food was driven by short term trends. A new food trend catches the consumers’ attention and grows…for 2 years. Then sales plateau or even drop…and we’re on to the next “must have”. After 2014, the changes became more pronounced and the situation got even more complicated. These complications are due to a number of factors starting with the move to high priced super premium foods, but including increased competition, especially from the internet, and behavioral changes, like increased value shopping. Let’s take a closer look at spending since 2014.
First, some specifics behind the record $5.65B (18.1%) increase to $36.84B. In 2020, the average U.S. Household spent a total of $280.38 on Pet Food. This was an 18.7% increase from the $236.26 spent in 2019. This doesn’t exactly “add up” to the 18.1% increase in total Food Spending. With additional data provided from the US BLS, here is what happened.
- 0.5% less U.S. CUs
- Spent 40.8% more $
- 15.7% less often
By the way, if 67% of U.S. CUs are pet parents then their annual Pet Food Spending is $418.48. Here’s a rolling history.
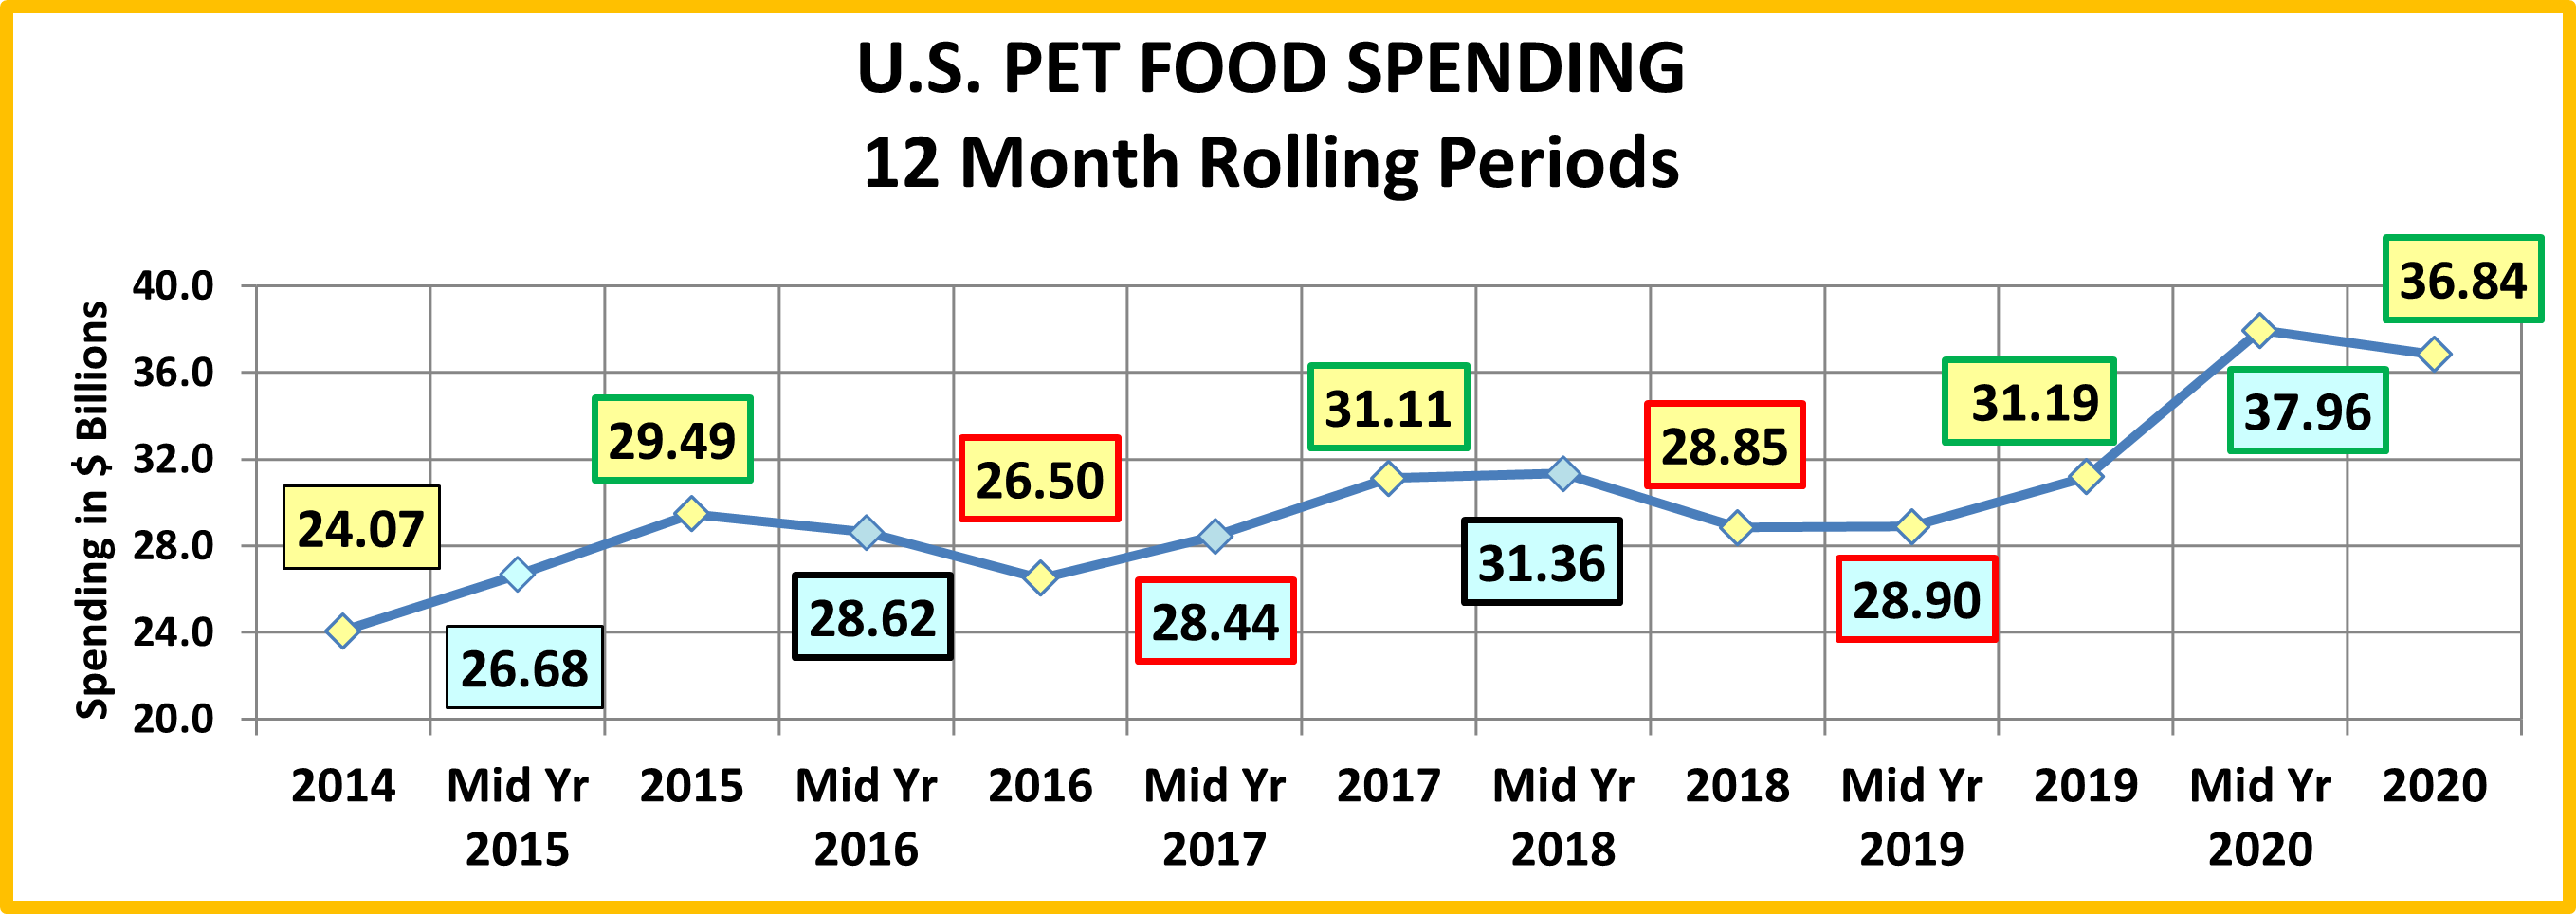
2014 marks the beginning of the Super Premium era. It began in the 2nd half of 2014 with the 25>34-year-old Millennials making the 1st move. In 2015 the Baby Boomers got on board in a big way, producing a $5.42B increase in spending, the biggest lift in history at the time. 2016 saw a spending change that was accelerated by the high prices of Super Premium Pet Foods. After consumers choose to upgrade to a more expensive pet food, their #1 priority becomes, “Where can I buy it for less?” “Value Shopping” on the internet was a major contributing factor in the big spending drop in 2016.
2017 was an up year which, based upon history, should have been due to a “must have” trend. There were some possible candidates, but nothing stood out. A deeper dive into the data showed that the $4B increase in Pet Food spending in 2017 didn’t come from a new trend. It came from a deeper demographic penetration of Super Premium foods. Value shopping in a highly competitive market, especially on the internet had made Super Premium pet foods more accessible to a broad swath of consumers.
Like Pet Food, human behavior has changed over the years in regard to our pets. In the 90’s, Pet Owners became Pet Parents. Then, after the turn of the century we began truly humanizing our pets. This movement is very accurately reflected in the evolution of Pet Food. We became increasingly more conscious of fulfilling the health needs of our pets, beginning with the first move to premium foods in 2004. This ramped up considerably after the Melamine scare in 2007. Now consumers read pet food labels, research ingredients and expect their pet foods to meet the same quality standards as the best human foods. This was very evident in 2018. It should have been a year of increased spending but the consumers’ reaction to the FDA grain free warning threw the pattern out the window. In the beginning of 2019 Pet Food spending stabilized as some doubts were raised about the validity of the warning. In the second half of the year Food Spending increased +$2.3B. Some Pet Parents began to return to the topline Super Premium Foods. In some cases, they opted for even more expensive varieties. We also saw some new groups get on board the Super Premium Express.
After the 2019 recovery came the pandemic of 2020. There is nothing more necessary to a Pet Parent than pet food. This spurred binge buying, especially in the 1st half of the year and drove the biggest annual spending increase in history.
The growth of Pet Food spending since 2014 reflects the rise of Super Premium but also another trend – the spectacular increase in the number and use of Pet Medications and Supplements, which are often produced in the form of treats. Together, the strength of Pet Food and these product subcategories reflect the Pet Parents’ absolute number 1 current concern – the health, wellbeing and safety of their Pet Children, which starts with the quality of their food. How big is this trend? Prior to the pandemic, at Global Pet Expo 2020, the 2 product categories with the most exhibitors were #1 Treats and #2 Supplements.
Now let’s look at some specific 2020 Pet Food Spending Demographics. First, we’ll look at income. Prior to 2014 it was a less dominant factor in Food spending. However, the move to Super Premium has brought it more to the forefront. In 2015 the spending of the over $70K group exceeded the <$70K for the first time. In 2020 it was almost twice as much. In 2020 the 2 big groups below $70K spent more than 2019 but all 3 big groups under $100K spent less than they did in 2015. The over $100K income group spent twice as much in 2020 as they did in 2015. Due to this movement to higher income groups, we have added a new measurement – spending over/under $100K. In 2015, the 50/50 divide on Pet Food spending was about $70K. In 2020 it is now approximately $107K, breaking the $100K barrier for the first time. It is also up from 87K in 2019. That’s a big change. The chart below shows the annual spending for the major income groups from 2015 through 2020. This should put the 2020 numbers into better perspective.
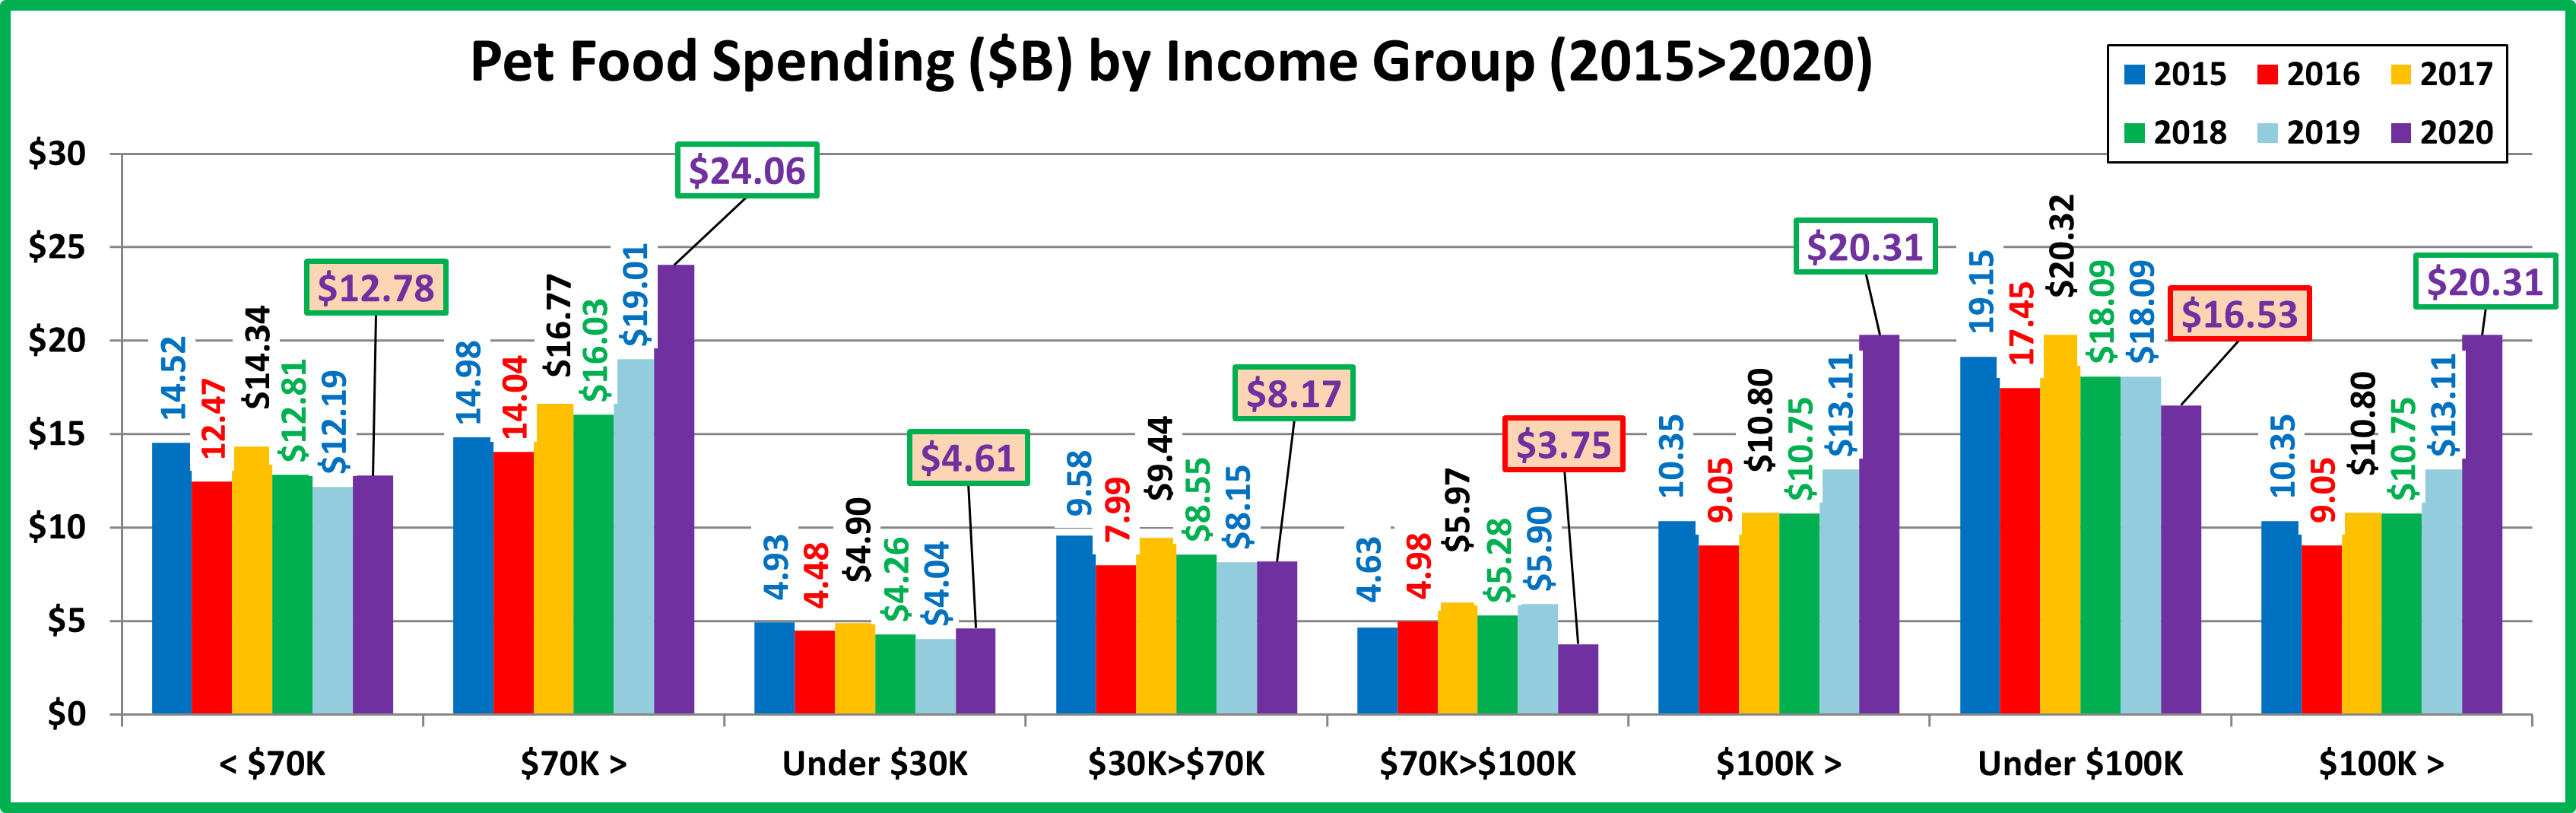
Before we get into the details for 2020, we should note the uniqueness of 2 years. With competitive pricing on Super Premium Foods and the consumers’ commitment to pet health, 2017 was the only year since 2015 with spending growth in every major income group. In 2018 the FDA grain free warning turned this situation around as all groups spent less. Now, 2020.
2020 National Numbers: $280.38 per CU (+18.7%); $36.84B; Up $5.65B (+18.1%); 2015>2020 – Up $7.35B (+24.9%)
The spending pattern was mixed. The groups <$70K and the $100K> group spent more while the middle income group spent substantially less. The inflation rate in 2020 fell from 2.9% to 0.1% which may have helped the low income groups.
Here are 2020 specifics:
- Under $30K: (25.4% of CU’s) – $146.95 per CU (+22.3%) – $4.61B – Up $0.57B (+14.2%). Obviously, this group is very price sensitive. It is also getting smaller. The number of CU’s was down 6.5% in 2020 and 18.8% since 2015. This decrease masks the true food situation. While their Total Food spending is lower than 2015, their Avg CU spending on food in 2020 is up 22.2%. Their Total Pet Food spending is being driven down by the substantial and consistent decline in the number of CUs. This makes their spending increase in 2020 even more significant. Even this lowest income group remains fully committed to their pets.
- $30K>$70K: (31.1% of CU’s) – $193.98 per CU (+1.2%) – $8.17B – Up $0.02B (+0.3%). This group had a 2.0% decrease in the number of CUs which basically negated their slight increase in spending. The Pet Food spending within this big group was definitely mixed. The $30>39K group lost CUs but they radically increased spending, +$0.95B (+45.4%). The $40>49K group grew +0.6% in numbers but they dialed back their spending -$0.13B. The average income for Retirees is now $42K so many are included in this group. They undoubtedly contributed to the growth in CUs but even their +$0.62B increase in Pet Food spending couldn’t turn the $40>49K group positive. Now, the most negative group, $50>69K. They lost 4.5% in CUs and spent -16.3% less per CU on Pet Food. These 2 factors pushed their Total Pet Food Spending down -$0.79B (-20.9%). It was a big drop but not enough to overcome the lift from $30>39K.
- $70K>$99K: (15.0% of CU’s) – $203.13 per CU (-33.7%) – $3.75B – Down $2.15B (-36.4%). The Pet Food Spending for this group had been very stable. In 2017, this changed as they got “on board” with Super Premium Pet Food. They also became more sensitive, reacting to the FDA warning in 2018, bouncing back in 2019 and then plummeting due to Covid in 2020. They are middle income, with family responsibilities and under considerable monetary pressure.
- $100K> (28.5% of CU’s) – $515.06 per CU (+44.0%) – $20.31B – Up $7.20B (+55.0%). 87% are college grads so they saw the value of Super Premium food very early. Their 2018 decrease in spending due to the FDA warning was minimal, -0.05B as many opted to move up to even more expensive types of food. They came back strong in 2019 and then were the driving force behind the huge lift in 2020. We should note that their lift was not universal. CUs making $100>149K or over $200K spent $8.89B more, while CUs making $150>199K spent $1.68B less. However, without the overall $100K> group, Pet Food Spending would have been down -$1.55B in 2020.
In 2018, the decrease in Pet Food spending was widespread across incomes. In fact, groups totaling 83.9% of all U.S. households spent less on Pet Food. In 2019, the rebound spending increase only happened for households with incomes above $40K, 61.4%. In 2020 the Pandemic lift occurred at both ends of the income spectrum but the $100K> group was the only true driver as their lift was 127% of the total increase. Besides the biggest increase in history, 2020 was significant for another reason. In the era of Super Premium, Pet Food spending has become increasingly tied to income. In 2020, the 50/50 dividing line on share of spending exceeded $100K for the 1st time. Now, Spending by Age Group…
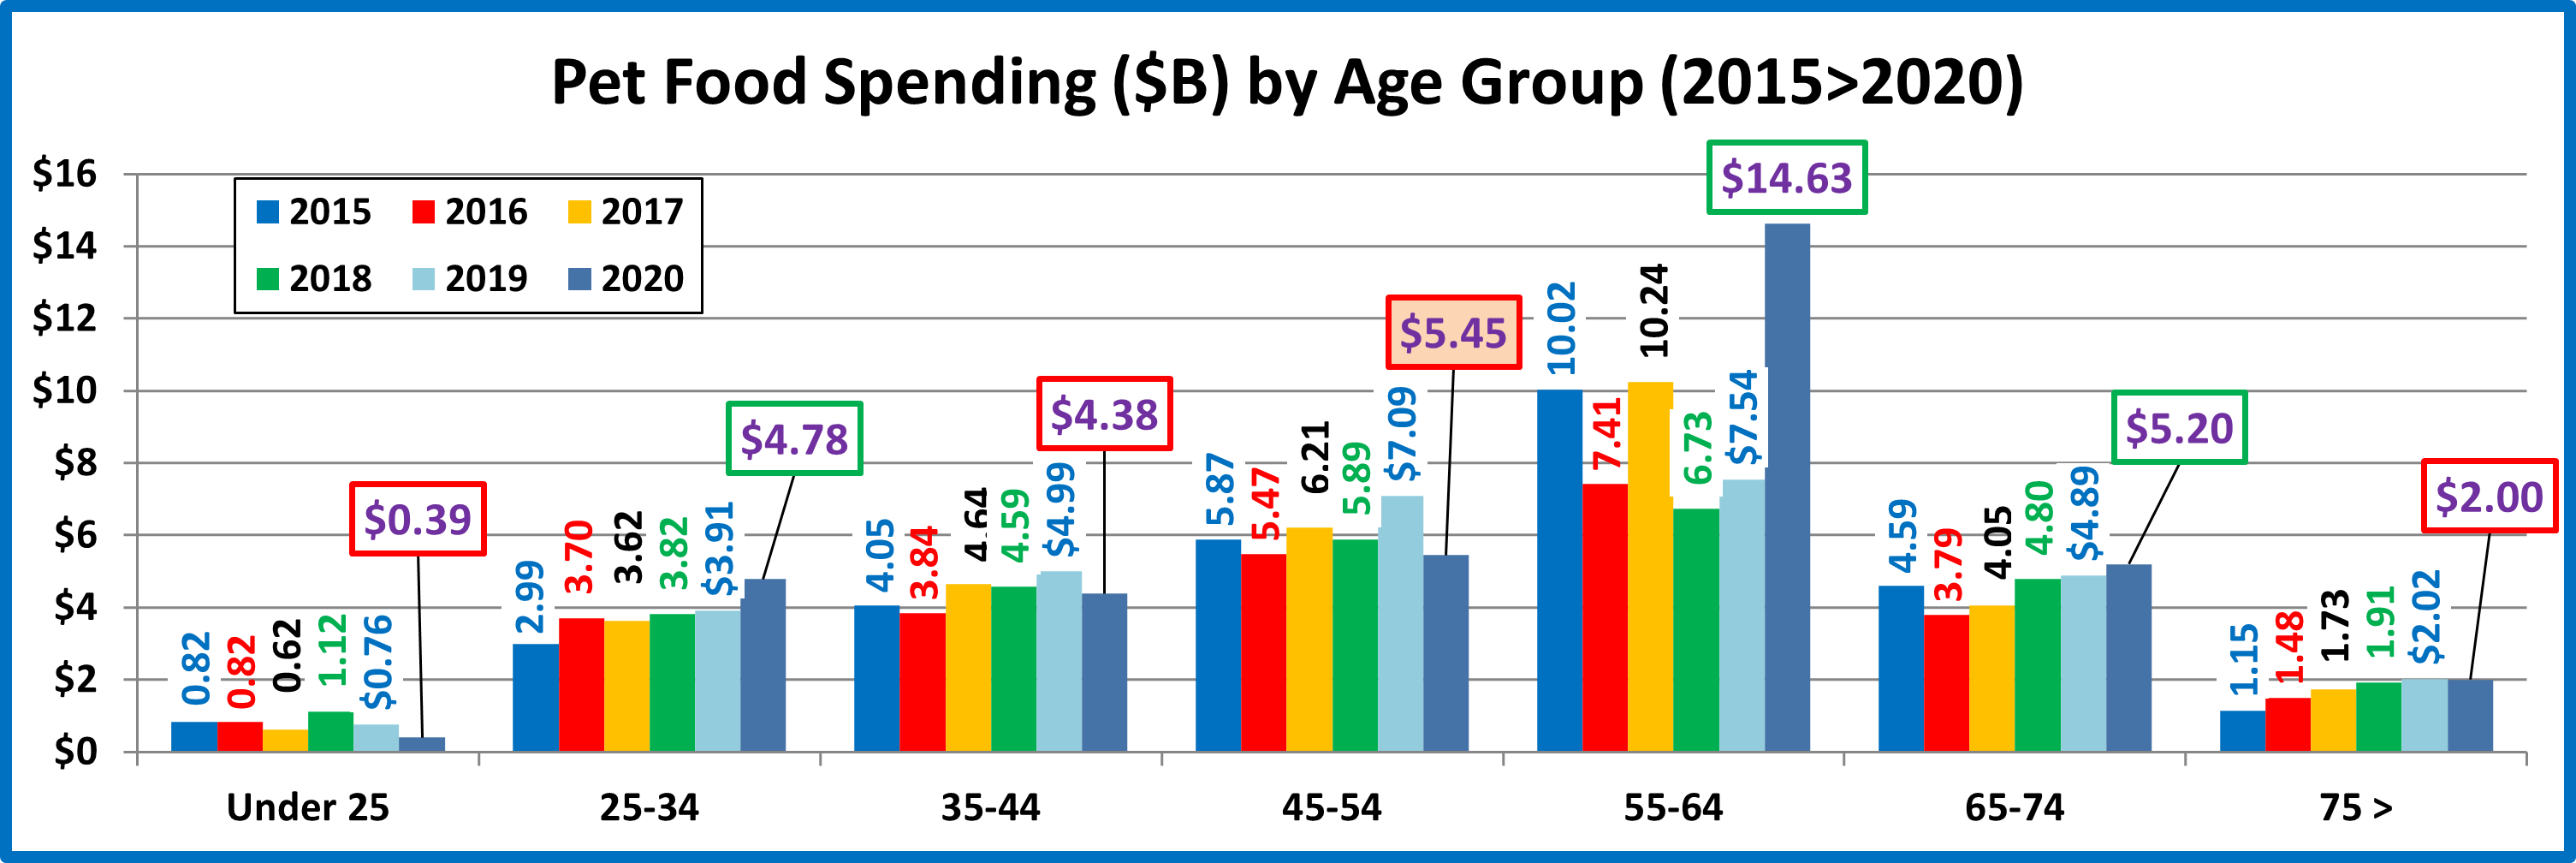
2020 National Numbers: $280.38 per CU (+18.7%); $36.84B; Up $5.65B (+18.1%); 2015>2020 – Up $7.35B (+24.9%)
One assessment, although it is not 100% accurate, is very close. That assessment is that It’s a generational thing. Baby Boomers and Millennials spent more. Gen X, Gen Z and those born before 1946 spent less.
- 55>64 (19.1% of CU’s) – $583.23 per CU (+90.2%) – $14.63B – Up $7.09B (+94.0%). This group (all Baby Boomers) has been at the forefront of recent major spending swings. In 2015 many of them upgraded to Super Premium. In 2016 this group looked for and found a better price. In 2017 they led a deeper penetration of the upgrade. In 2018 they had a -$3.5B reaction to the FDA warning. They began to recover in 2019 but it was far short of the drop. Then came 2020, which saw an unprecedented lift in spending. There were 3 major contributing factors. First was panic, binge buying due to pandemic. They also were still recovering from the FDA warning. Finally, the pandemic caused the loss of over 2 million <25 CUs. Many of them moved back with their parents. They obviously took their pets with them, so this contributed to the spending explosion in the 55>64 year old group.
- 45>54 (17.2% of CU’s) – $247.46 per CU (-21.7%) – $5.45B – Down -$1.63B (-23.1%). This group is #1 in income and total CU expenditures. Up until 2015 they were #1 in Pet Food spending. They bought premium food but didn’t “buy in” to Super Premium until 2017. They were negatively impacted by the FDA warning, but they rebounded stronger than any other group. In 2020, their spending dropped significantly. The decrease corresponded almost exactly to a $1.68B drop by the $150>199K income group. Although some may have dialed back their purchases. It is likely that most found value and cheaper prices by buying on the internet. They actually spent 9.7% more but 28.7% less often.
- 65>74 (15.6% of CU’s) – $248.30 per CU (-1.1%) – $5.20B – Up $0.32B (+6.5%). This group is now all Baby Boomers and growing (+2.0%). They are starting to retire but many are still working (0.6 per CU). Because of their reduced income, they are often slower to react to industry trends. However, they have shown slow but consistent growth every year since 2015. They are Boomers so their Pets are a major priority. They spend 1.13% of their total CU expenditures on their pets. Only the 55>64 yr olds spend a higher percentage.
- 35<44 (17.0% of CU’s) – $195.39 per CU (-13.9%) – $4.38B – Down -$0.61B (-12.2%). They are primarily young Gen Xers. They are 2nd in income and CU spending but have the biggest families so value shopping is a way of life. Their spending pattern tends to match the older Gen Xers but is less volatile. Their drop in frequency was 14.7%.
- 25>34 (16.0% of CU’s) – $222.60 per CU (+26.9%) – $78B – Up +$0.87B (+22.3%). In recent years the spending pattern of these Millennials has foreshadowed the overall market for the following year. However, no one could have predicted the pandemic. They reacted strongly with a 22.3% increase in $. They spent 30.6% more, 2.8% less often. Another situation should be noted. They are the most stable in spending. That is surprising.
- 75> (11.2% of CU’s) – $140.98 per CU (-5.1%) – $2.00B – Down -$0.02B (-1.1%). Both the effort and the expense of Pet Parenting become issues as we reach 75+. However, they remain committed to their Pets and high quality food.
- <25 (3.8% of CU’s) – $74.69 per CU (-24.5%) – $0.39B – Down -$0.37B (-48.4%). The number of CUs fell by 2.2M, -31.2%. Many moved back with their parents or in with other adults. It’s obvious by the big drop in CU Pet Food spending that those who maintained their households had a lower percentage of pet ownership.
The situation in the age groups in 2020 seems to be a generational divide. With Boomers & Millennials on the plus side and everyone else on the downside. Another significant event was that the title for top Pet Food spending CU was passed back to young Baby Boomers from old Gen Xers. The Boomers built the Pet Industry. Their dominance will inevitably fade but it will take a long time. Need proof? Look at the ongoing strong performance by the 65>74 year olds.
We need to drill deeper. Let’s take a look at the segments with the biggest change in spending in 9 categories. The segments that are outlined in black “flipped” from 1st to last or vice versa from 2019. The red outline stayed the same.

We have seen some big spending swings in recent years. Some were industry driven. Others were due to an outside influences like the FDA warning in 2018 and now the Pandemic in 2020. These outside influences had a common driver – fear. The FDA warning caused Pet Parents to back away from grain free dog food. The Pandemic caused many of them to stock up on (binge buy) their Super Premium Pet Food. This produced the biggest Pet Food Spending Lift in history. 2019 saw a recovery lift but it was almost a “normal” year in between the 2 big swings in 2018 and 2020.
The 2020 lift was truly a spectacular year of growth, but it was also somewhat stable as 5 of the 9 segments with the biggest growth were the same as 2019 and are often the best performers. The 55>64 yr olds are a true subset of the Baby Boomer group. They have been on top 3 times since 2015. Only 2 segments flipped from 1st to last and they are really the same group, Gen X. Among the losers, Renters repeated but the others were new. There were a few definite surprises. Gen X, 2 people CUs and the Big Suburbs are usually among the leaders in spending.
You see that the biggest increases were notably larger than the decreases. This was the pattern across the demographic categories. The lift was driven by specific segments. In fact, 49% of 96 demographic segments actually spent less on Pet Food. This is not what you would expect in a year that produced the biggest spending increase in history.
This Pandemic lift was fear driven and very emotional. Although most groups now view pets as part of the family, there is one group that will always be at the top, Baby Boomers. They were the first Pet Parents and their love for their Pet Children truly fueled the spectacular growth of the Pet Industry. This emotional connection has driven many big swings in spending in recent years. There is another consideration. Generations are segments with almost the same individuals every year. The 2020 lift was largely driven by a specific group – Baby Boomers. We’ll see what 2021 brings.


Trackbacks & Pingbacks
[…] is the largest in the history of the survey, according to John Gibbons, the self-proclaimed Pet Business Professor, who analyzed the data on his blog. (Because the data comes from the government, it tends to take a […]
[…] is the largest in the history of the survey, according to John Gibbons, the self-proclaimed Pet Business Professor, who analyzed the data on his blog. (Because the data comes from the government, it tends to take a […]
Comments are closed.