
2018 U.S. Pet Spending by Generation – A Baby Boomer Bust?
In 2018 Americans spent $77.60B on our companion animals, 0.98% of $8.0 Trillion in total expenditures. Pet Spending was up only $1.47B (+1.9%), a marked change from the +$9.8B in 2017. There were a number of factors affecting pet spending in 2018. The FDA warning regarding grain free dog food helped drive spending down. Increased tariffs on Supplies flattened spending late in the year in that segment. Veterinary Services had a small increase, but it was almost entirely driven by inflation. The only truly good news came from Services, which had the biggest increase in history.
In this report we will look at how these factors and others affected the Pet Spending for today’s most “in demand” demographic measurement – by Generation. Baby Boomers have driven the industry. Are they starting to fade? Are Gen Xers and Millennials stepping up? Using data from the US BLS Consumer Expenditure Survey we will look for answers.
We’ll start by defining the generations and looking at their share of U.S. Consumer Units (CUs are basically Households)
GENERATIONS DEFINED
-
-
-
-
-
-
- Millennials: Born 1981 to 1999. In 2018, Age 19 to 37
- Gen X: Born 1965 to 1980. In 2018, Age 38 to 53
- Baby Boomers: Born 1946 to 1964. In 2018, Age 54 to 72
- Silent Generation: Born 1928 to 1945. In 2018, Age 73 to 90
- Greatest Generation: Born before 1928. In 2018, Age 91+
-
-
-
-
-

- Baby Boomers are still the largest number of CU’s at 43.8M and 33.3% of the total but they are losing ground. In fact, they have 1.3M fewer CU’s than in 2016.
- The 2 Oldest Generations will continue to lose CUs primarily due to death or movement to permanent care facilities. On the other side, the Gen Xers increased their CU count. One factor is a rising divorce rate in the 45+ age group.
- Millennials have the largest number of individuals, but they rank only third in the number of CU’s. However, this number is rapidly growing as once again a significant number gained financial independence in 2018.
Now let’s look at some key CU Characteristics

The only significant change was the increase in homeownership by the Gen Xers and Millennials. However, the overall homeownership numbers didn’t change due to a decrease by the oldest Americans.
- CU Size – CUs with 2+ people account for 70.5% of all U.S. CUs (down from 71.3% in 2017) and 80.9% of pet $ (down from 82.5% due to a spending drop by 2 person CUs). Despite 2+ million more CUs, Millennials held their ground. CU size, with all the related responsibilities, still peaks with the Gen Xers and then starts dropping. The Boomers are the last group with 2+ CUs. However, their size fell from 2.2 to 2.1 probably because many adult children moved out.
- # Children < 18 – 28.0% of U.S. CU’s have children and they generate 30.5% of Pet Spending. Driven by a $2.4B increase by Married Couples with children, CUs with children are once again earning their share. However, the story is more complex. As expected, Single parents spent the least, but the big change came in Married Couple only CUs – down -$1.72B. However, the Pet Spending drop for all 2+ CUs without children was even worse, -$2.5B. Thankfully, single CUs were up $1.64B. There were no changes in the # of children per CU in 2018 but there were definite changes in pet spending behavior. Married with Children and singles both spent significantly more on their pets. The Married with Children group tends to skew younger, but singles have higher numbers at both ends of the age range.
- # Earners – While not as important as income, Pet spending is also tied to the number of earners in a CU. 2+ person, 2 Earner CUs annually spend 19% more on their pets than 1 Earner CUs. As the chart shows, the “earning” is being done in America by Gen Xers, Millennials and Boomers. However, the Boomers will inevitably fade.
- Homeownership – Owning and controlling your own space has been a major factor in increased Pet Ownership and spending. Driven by the younger groups, homeownership increased to 63.48% from 62.9%. Homeowners w/mtges spent $3.3B more on their pets but couldn’t overcome a -$3.4B drop from homeowners w/no mtge. As a result, the homeowners share of Total Pet Spending fell from 81.4% to 79.8%. Ultimately, renters, with a $1.64B increase kept the industry positive for the year. The key to increased pet spending in 2018 was paying a monthly housing bill.
- Millennials are still the most common renters in society, but their level of Homeownership increased from 35% to 37%. However, it is still only 58% of the national average and about 2/3 of the rate of Gen Xers and Boomers when they were the same age.
- Gen Xers passed the national average in 2018 and Homeownership continues to increase up to age 90.
Next, we’ll compare the Generations to the National Avg.:
In Income, Total CU Spending, Total Pet Spending and the Pet Share of Total CU Spending
CU National Avg: Income – $78.635; Total CU Spending – $61,160; Total Pet Spending – $598.41; Pet Share – 0.98%
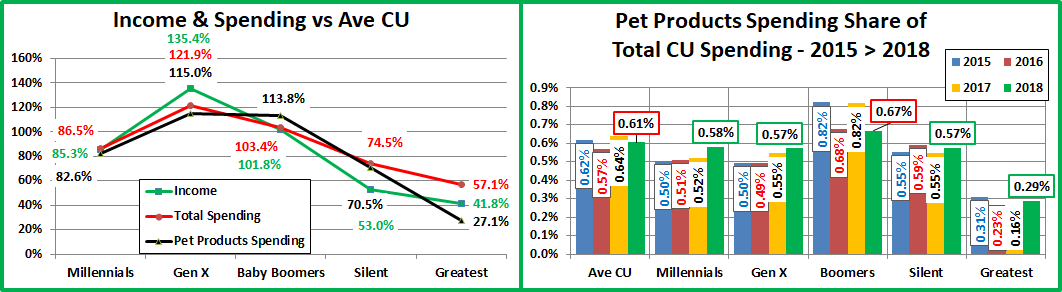
- Income – The Gen Xers are the leaders and widened the gap with a 12.1% increase. The Boomers earn 25% less but are the only other group to exceed the national average. Income drops radically in the older groups as retirement becomes almost universal. Millennials’ income grew 9% but is less than the Boomers and only 63% of the Gen Xers.
- Total Spending – The Gen Xers make the most and spend the most but it’s not out of line with their income. Boomers also spend more than the average but their after tax income still supports it. The older groups are actually deficit spending in relation to their after tax income. The Millennials’ spending increased 3.1%, second only to the +3.3% by Gen Xers. With increases in CUs, Income and Spending, the Millennials’ retail importance is still growing.
- Pet Spending – Only 2 groups exceed the national average. However, for the first time, Boomers don’t hold the top spot. That now belongs to the Gen Xers. Millennials also made a significant move, up to 81.4% from 69.6% in 2017.
- Pet Spending Share of Total Spending – The national number fell slightly from 0.99% to 0.98%. However, the most significant change can be seen in comparing the 2017 and 2018 numbers for all groups. The Boomers dominated in 2017, with 1.28% of all their expenditures being spent on their pets. In 2018, they are still the only group to spend more than 1% of their total on their pets. However, every other group had an increase. In fact, all CUs under 90 yrs old now spend at least 0.92% of total spending on pets. This is an amazing balance and bodes well for the future.
Now, let’s look at Total Pet Spending by Generation in terms of market share as well as the actual annual $ spent for 2014 through 2018. The 2018 numbers are boxed in red (decrease) or green (increase) to note the change from 2017.

- Boomers are still the biggest force in Pet Spending, but their share fell precipitously to 37.7% from 46.8% in 2017.
- There are definite age-related patterns which are readily apparent in the bar graph. Spending in the oldest groups is relatively low and falling. In contrast, the two youngest groups are showing consistent year after year growth which spiked in 2018. The Boomers are in the middle. They still have the biggest share but are also the most likely group to have a strong reaction to trends, especially in this era of super premium foods. With their tremendous buying power, this can cause major spending swings impacting the whole industry.
- In 2018, the Boomers spending plummeted, -$6.5B, but the Gen Xers and Millennials stepped up, +$7.2B. The older groups also contributed, with double digit percentage increases.
- Boomers – Ave CU spent $672.03 (-$132.91); 2018 Total Pet spending = $29.61B, Down -$6.48B (-18.0%)
- 2014>2018: Up $0.14B; They have been on a spending roller coaster and are now back to their 2014 $ level.
- Gen X – Ave CU spent $708.32 (+$91.95); 2018 Total Pet Spending = $25.15B, Up $3.81B (+17.9%)
- 2014>2018: Up $7.39B; Their annual Pet spending growth since 2014 has been the most consistent of any group, but their 2018 increase of $3.8B surpassed their total increase from 2014 to 2017.
- Millennials – Ave CU spent $486.85 (+$73.71); 2018 Total Pet Spending = $16.92B, Up $3.42B (+25.4%)
- 2014>2018: Up $7.23B; The Millennials had a big lift in spending in 2014 but Spending grew only slightly in 2015. Since then, their total pet spending has grown by over $7B, with almost half of this coming in 2018.
- Silent Gen. – Ave CU spent $420.46 (+$51.66); 2017 Total Pet Spending = $6.72B, Up $0.66B (+10.8%)
- 2014>2018: Down $0.15B; They still spend a relatively high amount on their pets, but age is becoming a factor.
- Greatest Gen.– Ave CU spent $179.73 (+76.82); 2017 Total Pet Spending= $0.19B, Up $0.06B (+40.8%)
- 2014>2018: Down $0.34B; After a lifelong commitment to their pets, their Pet Parenting days are fading away.
The Boomers backed off in Pet Spending in a big way in 2018, but the younger groups immediately made up the difference…and more. Plus, the oldest groups also stepped in to help generate a more positive year for the industry.
Let’s look at the individual segments. First, Pet Food…

- For Boomers and the younger groups, the up and down, trendy nature of Pet Food is readily apparent, but the swings in spending are more pronounced for the Boomers. In the older generations, pet ownership is fading.
- The Millennials’ have led the way in food trends, including value shopping and their performance in any given year was matched in the following year by Gen Xers and Boomers …until 2018, when the Boomers broke the pattern.
- Boomers – Ave CU spent $264.73 (-$84.19); 2018 Pet Food spending = $11.78B, Down $3.93B (-25.0%)
- 2014>2018: Up $2.04B – After a big lift in 2017, spending plummeted, in part as a reaction to the FDA warning.
- Gen X – Ave CU spent $234.05 (+9.53); 2018 Pet Food spending = $8.32B, Up $0.61B (+7.9%)
- 2014>2018: Up $1.33B If this highest income group reacted to the FDA, it was to further upgrade their food.
- Millennials – Ave CU spent $174.76 (+$20.36); 2018 Pet Food Spending $6.04B, Up $0.99B (+19.6%)
- 2014>2018: Up $1.76B They are the only group with increases in 2016, 2017 and 2018. They are growing in numbers and in their commitment to their pets. Since 2014 they have been the pioneer in food upgrades.
- Silent Generation – Ave CU spent $170.43 (+$13.80); 2018 Pet Food spending = $2.67B, Up $0.10B (+3.9%)
- 2014>2018: Down $0.21B; They remain committed to their pets, but their numbers are starting to fade.
- Greatest Gen. – Ave CU spent $34.76 (-$16.94); 2018 Pet Food spending = $0.03B, Down $0.03B (-53.1%)
- 2014>2018: Down $0.15B; CUs are down 60% since 2014. At 91+ years old, their pet parenting days are ending.
Pet Food Spending is driven by trends. In 2018, the FDA warning for grain free dog food created a turmoil. Boomers dialed back to more regular food. However, it appears that the younger groups were unaffected or may have upgraded to even more expensive varieties. Now, let’s look at Supplies Spending.

- Boomers still have the largest share, barely, but the younger groups have their biggest “presence” in Supplies. Gen Xers and Millennials together account for 57.6% of Supplies spending.
- Baby Boomers – Ave CU spent $156.81 (-$10.71); 2018 Pet Supplies spending = $6.86B, Down $0.62B (-8.3%)
- 2014>2018:Up $0.19B; A big lift in 2017, then a cut back in 2018. They may be the only group impacted by tariffs.
- Gen X – Ave CU spent $192.20 (+$20.46); 2018 Pet Supplies spending = $6.82B, Up $0.85B (+14.2%)
- 2014>2018: Up $1.34B; Gen Xers perform best in Supplies. They paid for their Food Upgrade in 2015 with Supplies $ but they have come back strong. They lead in CU spending and are virtually tied in $ with the Boomers.
- Millennials – Ave CU spent $131.13 (+$18.79); 2018 Pet Supplies spending = $4.57B, Up $0.90B (+24.7%)
- 2014>2018: Up $1.54B; Supplies are again Millennials’ best performing segment. In 2016 they cut spending to help fund increases in Food and Veterinary. Since then, they have come back strong, +$1.8B.
- Silent Generation – Ave CU spent $90.69 (+3.77); 2018 Pet Supplies spending = $1.47B, Up $0.04B (+2.7%)
- 2014>2018: Down $0.23B; Pattern is similar to Gen X, but not as pronounced and with lower results.
- Greatest Gen. – Ave CU spent $65.77 (+$50.99); 2018 Pet Supplies spending = $0.07B, Up $0.05B (+249%)
- 2014>2018: Down $0.05B; Supplies generally have a lower priority for these oldest Pet Parents, but not in 2018.
Most groups cut back on Supplies spending in 2015 due to a combination of rising prices and an attempt to compensate for the cost of upgrading their pet food. In 2016 Consumers value shopped for food and spent some of the saved money on Supplies. Supply prices dropped in 2017 and basically everyone under 90 years spent more! Late 2018 saw added tariffs. Boomers dialed back their purchase frequency. Everyone else was either unaffected or bought more, early.
Next, we’ll turn our attention to the Service Segments. First, Non-Veterinary Pet Services

- Gen Xers took over from the Boomers. This segment is skewing younger as the Gen X/Millennial share is now 60.2%.
- Baby Boomers – Ave CU spent $62.99 (-$2.53); 2018 Pet Services spending = $2.76B, Down $0.17B (-5.9%)
- 2014>2018: Up $0.08B; Boomers still need Services. Their spending drop was the smallest of any segment.
- Gen X – Ave CU spent $94.22 (+$39.54); 2018 Pet Services spending = $3.34B, Up $1.44B (+75.9%)
- 2014>2018: Up $1.75B; Had a big increase in income. Spent significantly more for the convenience of Services.
- Millennials – Ave CU spent $54.71 (+$17.96); 2018 Pet Services spending = $1.91B, Up $0.71B (+59.0%)
- 2014>2018: Up $1.20B; They are the only group with an increase every year, but spending “took off” in 2018.
- Silent Generation – Ave CU spent $43.66 (-$0.92); 2018 Pet Services spending = $0.71B, Down $0.02B (-3.6%)
- 2014>2018: Up $0.05B; They definitely have a need. Their spending has been reasonably consistent.
- Greatest Gen. – Ave CU spent $6.62 (+$2.92); 2018 Pet Services spending = $0.007B, Up $0.002B (+42.6%)
- 2014>2018: Down $0.03B; A continued drop in the number of CU’s and in pet parents, but eked out an increase.
This segment has always found a way to grow every year – until 2017. The small drop in spending was caused by a combination of factors. An extremely competitive environment created deals so even with increased frequency, consumers paid less. In 2018, the increased number of outlets really hit home, especially for the younger groups. Gen Xers and Millennials used some of their rising incomes to spend $2.15B more for the convenience of Pet Services.
Now, Veterinary Services

- Boomers are still the biggest spenders in this segment, but they only lead the Gen Xers because they have more CUs.
- The younger groups both have a consistently growing commitment to this Pet Parenting responsibility. The combined veterinary spending of Millennials and Gen Xers has increased $5.7B (+106%) since 2014.
- Boomers – Ave CU spent $187.50 (-35.48); 2018 Veterinary spending= $8.21B, Down $1.76B (-17.7%)
- 2014>2018: Down $2.17B; Like Food, the other “need” segment, they cut Veterinary spending by a double digit %.
- Gen X – Ave CU spent $187.85 (+$22.42); 2018 Veterinary spending= $6.67B, Up $0.91B (+15.9%)
- 2014>2018: Up $2.97B; Since 2016, their Veterinary spending has exceeded the CU Average. In 2018, although only by a margin of $0.35 per year, they took over the top spot in CU spending.
- Millennials – Ave CU spent $126.25 (+$16.60); 2018 Veterinary Spending $4.40B, Up $0.82B (+23.0%)
- 2014>2018: Up $2.73B; Their CU spending is up 100% since 2014. Veterinary has become a much bigger priority.
- Silent Generation – Ave CU spent $115.68 (+$35.01); 2018 Veterinary spending $1.87B, Up $0.55B (+41.1%)
- 2014>2018: Up $0.24B; Money is always a factor, but they are still committed to the health of their pets.
- Greatest Generation– Ave CU spent $72.58 (+$39.79); 2018 Veterinary spending= $0.08B, Up $0.03B (+73.5%)
- 2014>2018: Down $0.12B; Veterinary care is still a big priority for the remaining pet parents in this oldest group.
Gen Xers and Millennials have consistently increased their commitment to Veterinary Services. In 2014, their share of Veterinary Spending was 30%. It is now 52.1% – a 74% increase. This is a big, fundamental change in spending behavior.
One last chart to compare the share of spending to the share of total CU’s for the 4 largest generations.

- Gen X Performance – Total: 118.5%; Food: 106.8%; Supplies: 127.6%; Services: 142.0%; Veterinary: 116.3%
- In 2018 the Gen Xers took over the top spot in performance from the Boomers. They “earned their share” in every industry segment as well as Total Pet. They have increased their Total Pet Spending every year since 2014. During this time, their spending has become more diverse and their performance has improved. The only reason that they are not the leaders in Total $ is that the Boomers have more CUs. Gen Xers range in age from 38 to 53 so they are just entering the peak earning years. Expect their commitment and pet spending to continue to grow.
- Baby Boomers Performance–Total: 113.1%; Food: 122.7%; Supplies: 104.1 %; Services: 94.9%; Veterinary: 116.1%
- Boomers led the way in building the industry and are still the “top dogs” in $. They earn their share and in fact, are the still the spending leader in Total Pet and every segment but Services. However, their CU numbers are beginning to fall – down 1.3M (-3%) since 2016. Their spending drop in 2018 was by far the biggest ever and the only time that they spent less in every segment. They should hold the lead in Pet $ for several more years and be a major force for many more, but the Gen Xers and then Millennials are preparing to take their turn at the top.
- Millennials Performance – Total: 81.2%; Food: 79.0%; Supplies: 87.1%; Services: 82.4%; Veterinary: 78.2%
- Like the Gen Xers, Millennials have increased their pet spending every year since 2014. Their spending has also become more evenly balanced across the segments. They are growing in CU numbers but their future as the Pet Parenting spending leaders is still a long way off. They need increased income and a more stable home situation. They are educated and well connected. Indications are that they may lead the way in adopting new trends, especially in food. Their progress is good news, but in reality, their leadership is still more than a decade away.
- Silent Generation Performance – Total: 69.4%; Food: 75.1%; Supplies: 60.2%; Services: 65.8%; Veterinary: 71.6%
- This group ranges in age from 73 to 90. Pet Parenting is more challenging after age 75. The desire and the commitment to their pets is still there. This is evident in the fact that 0.92% of their total CU spending is on pets.
Baby Boomers are still the Pet $ leaders, but Gen Xers, followed by Millennials are ultimately the future of the industry. Both groups seem ready, willing and able to take their turn at the top. As these groups have risen, Pet Spending has become more balanced across the generations. This bodes well for the continued strong growth of the industry.

Trackbacks & Pingbacks
[…] Child boomers make up 37.7 p.c of pet spending. [Source: Pet Business Professor] […]
[…] Baby boomers make up 37.7 percent of pet spending. [Source: Pet Business Professor] […]
Comments are closed.