Spending, CPI, demographics of overall market

2024 Veterinary Spending was $41.26B – Where did it come from…?

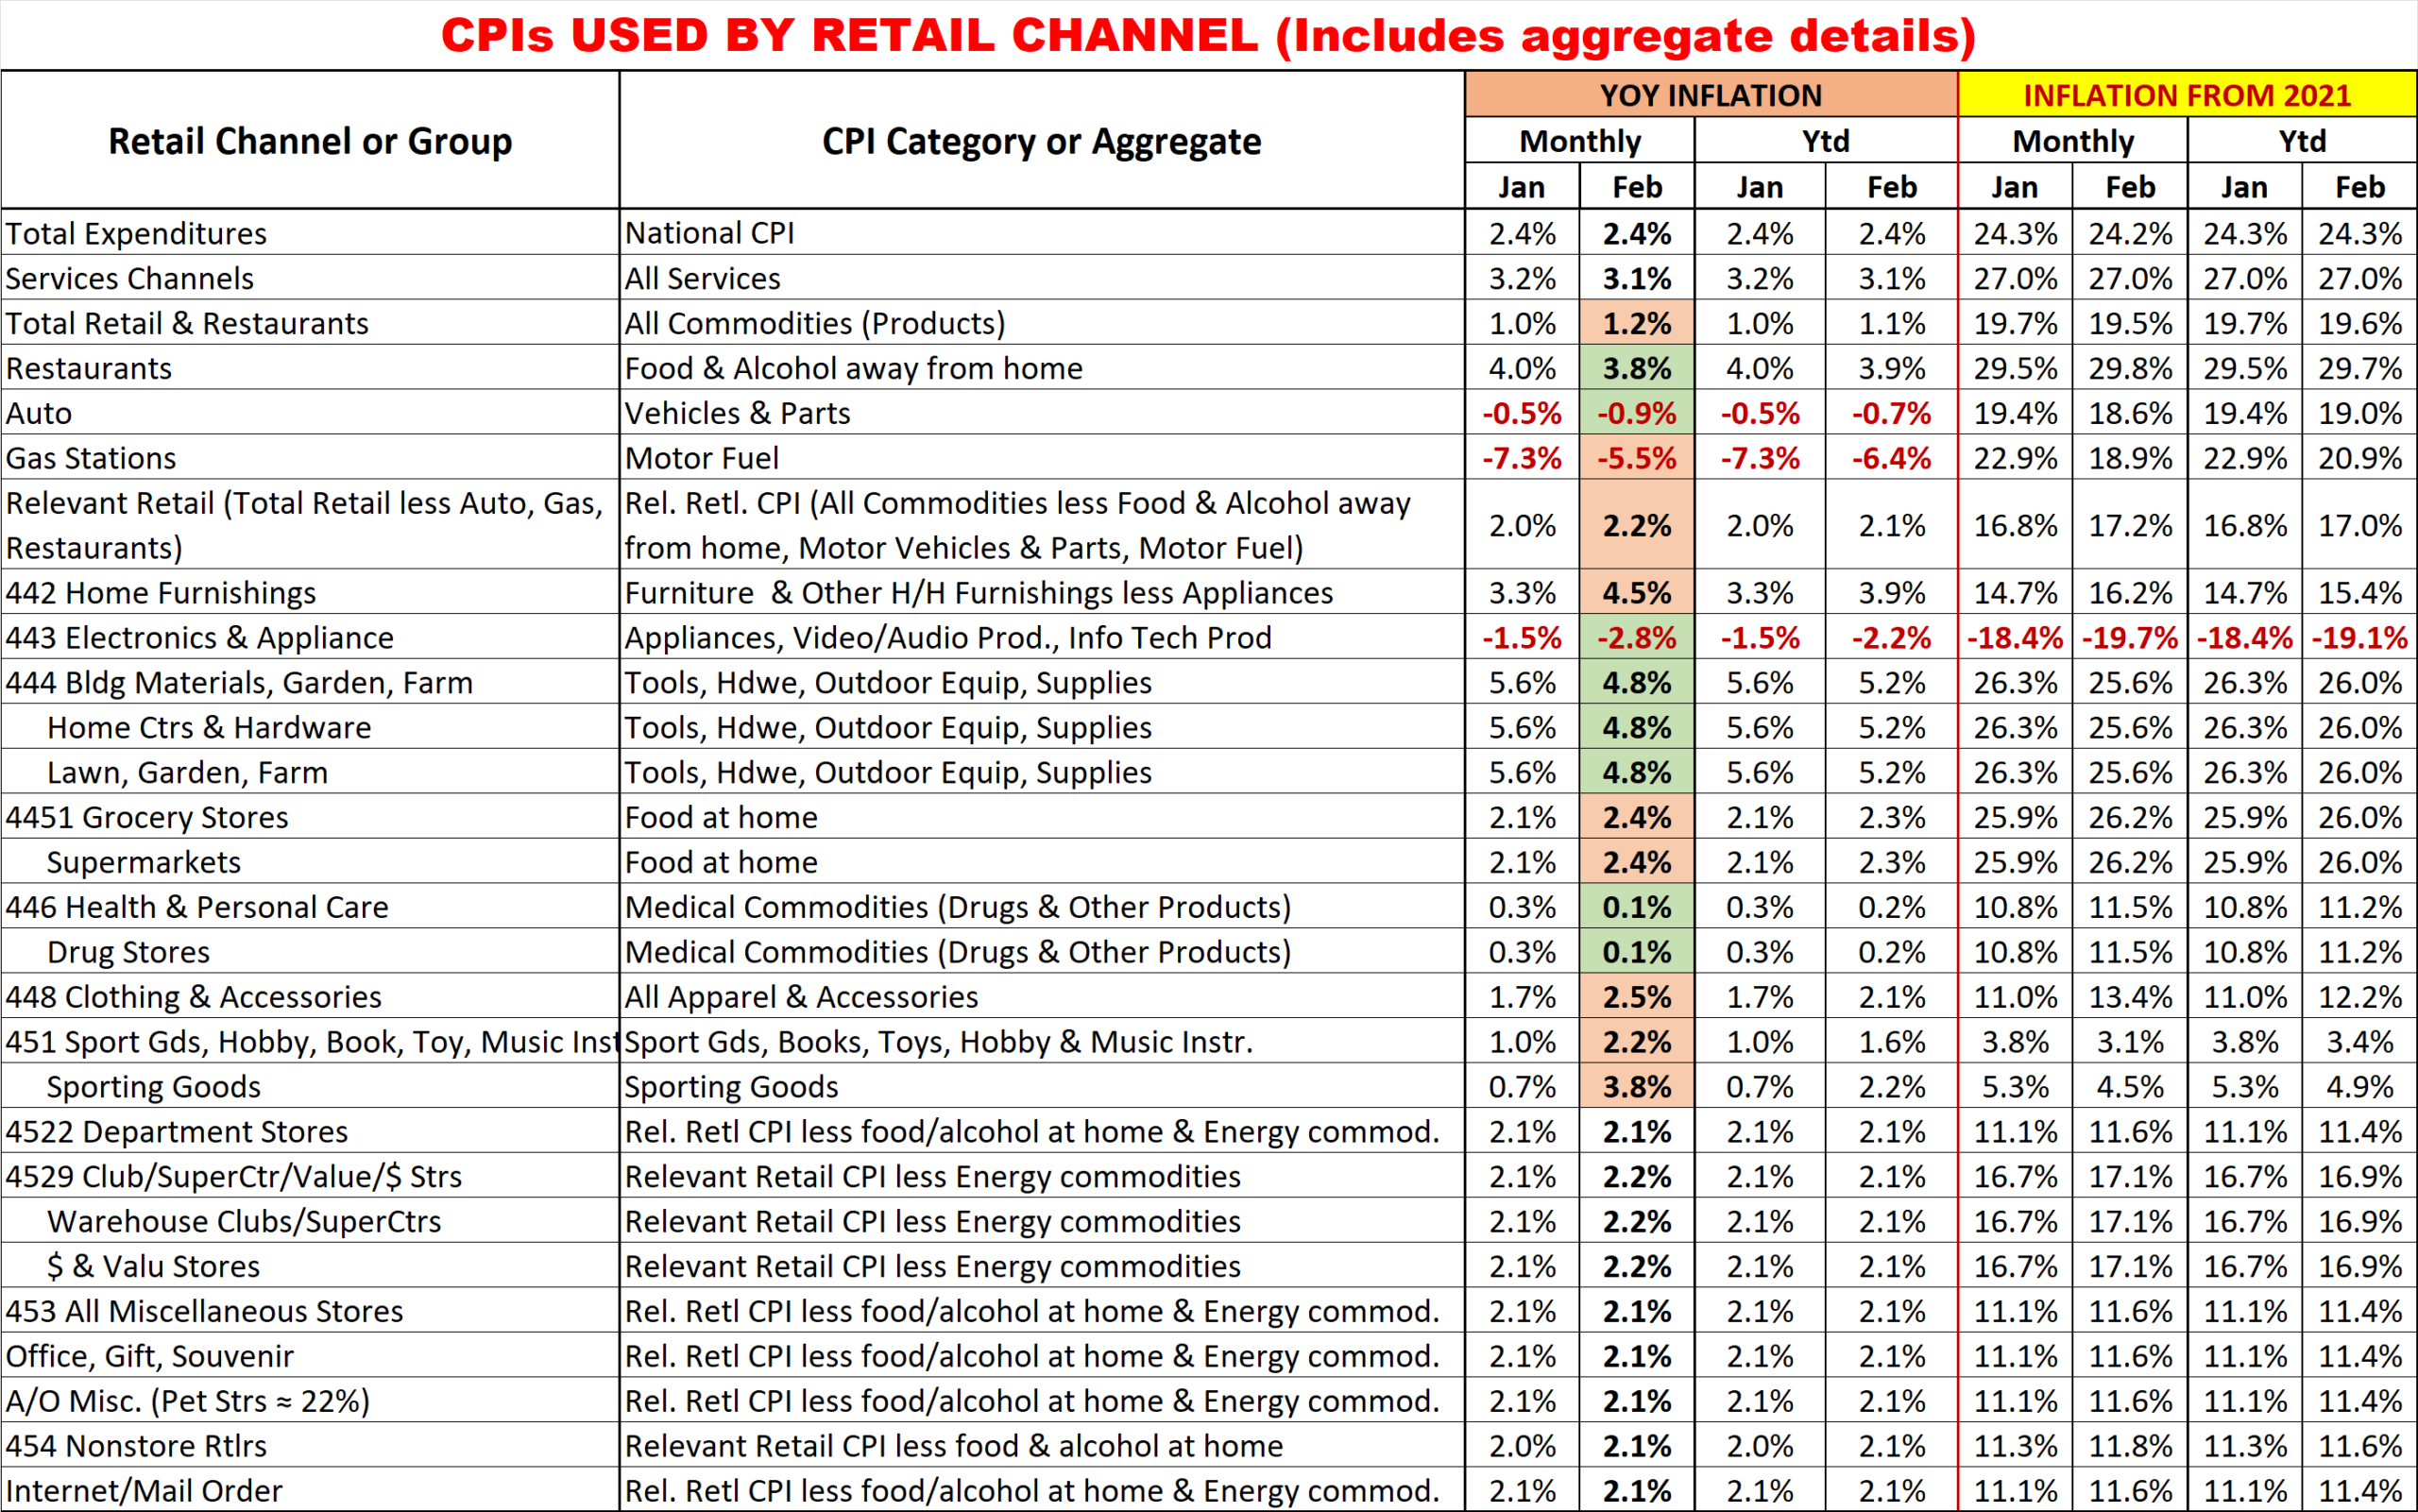
Now we will turn to Veterinary Services. For years, Veterinary Services have had high inflation. This has resulted in CU income becoming the dominant factor in spending and a reduction in visit frequency.

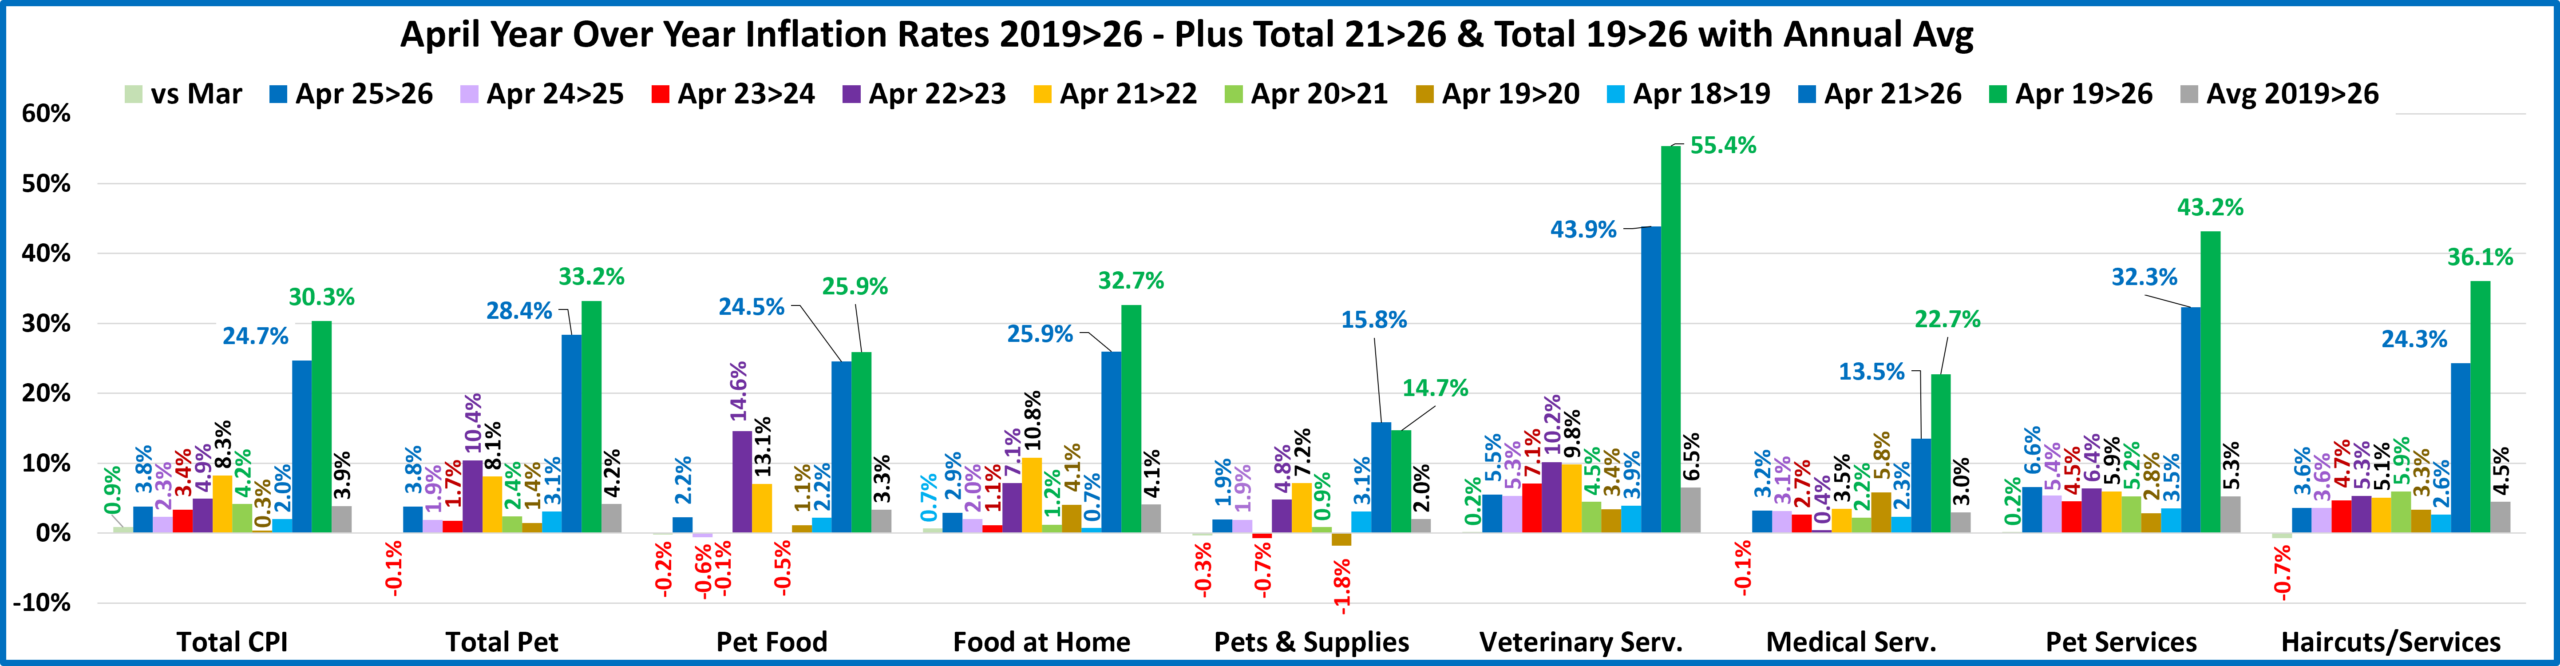
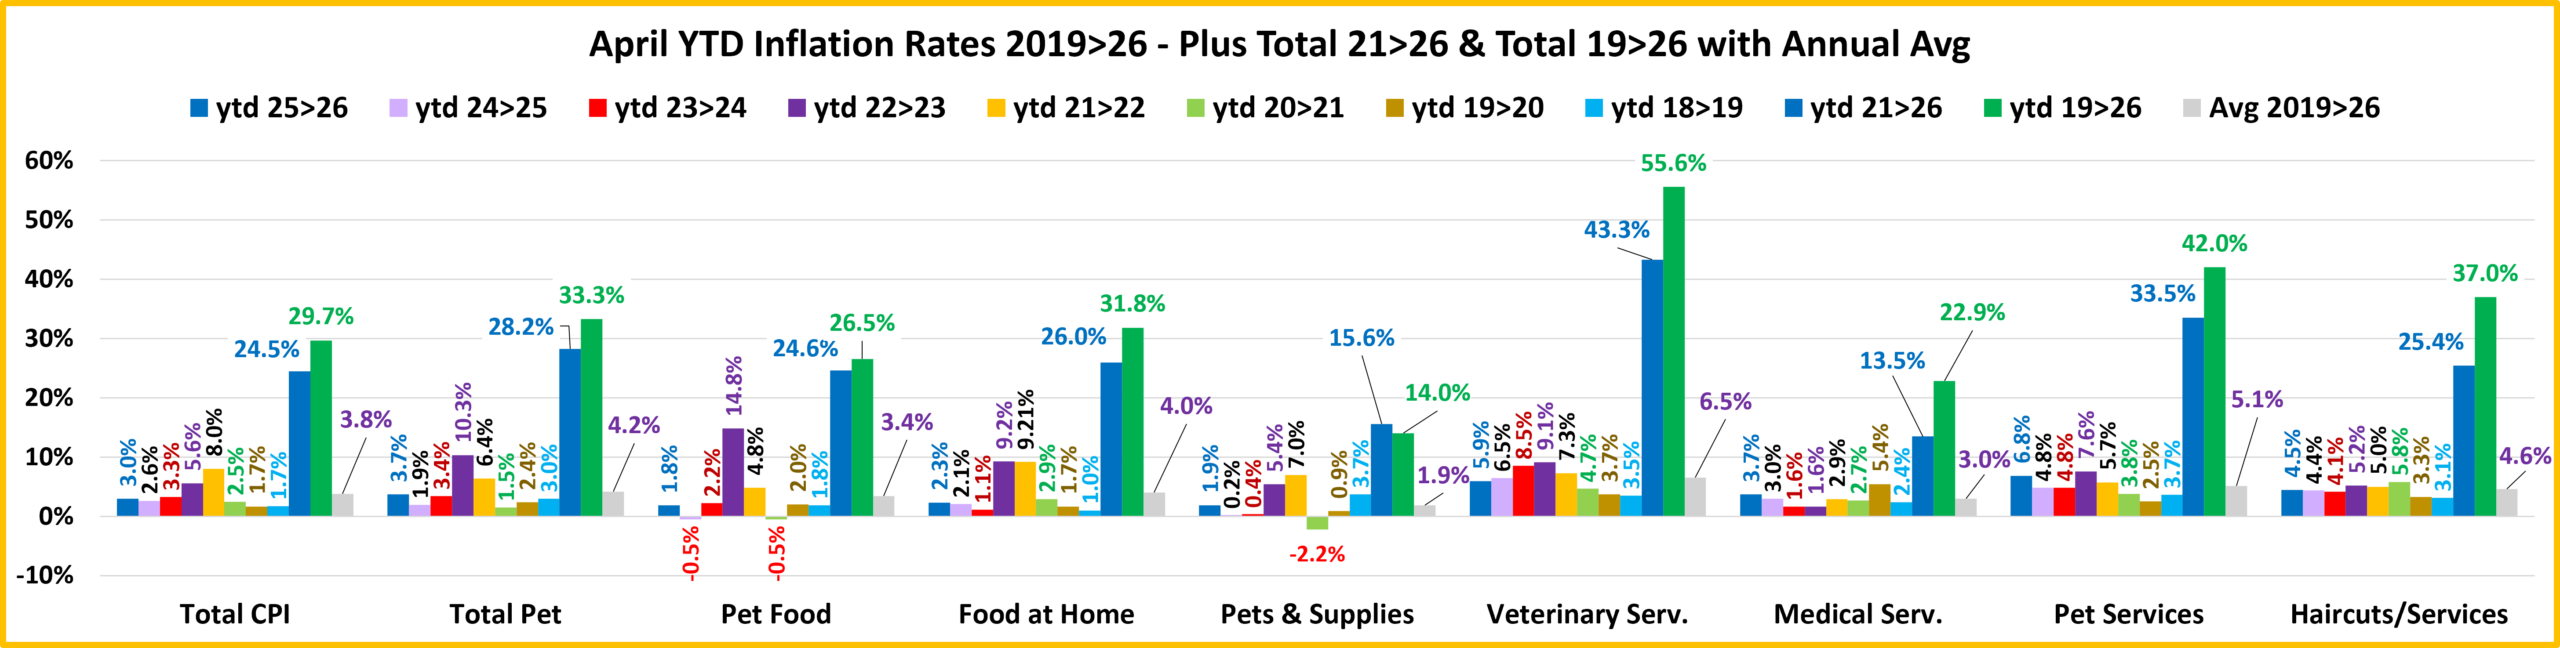
In 2017 low inflation drove a 7.2% increase in visit frequency and a $2.5B spending lift. In 2018 inflation returned to normal. Consumers spent $0.56B more (+2.7%), but inflation was 2.6% so almost all of the lift was from higher prices. In 2019 the situation got worse. Consumers spent $0.58B (+2.7%) more but inflation was 4.1% so there was a decrease in the amount Vet Services purchased. In 2020 the pandemic hit, and Pet Parents focused on needs – Food & Veterinary. Veterinary spending grew $3.05B, (+14.0%). In 2021, this behavior grew even stronger and produced a record $7.82B (+31.5%) increase. In 2022 inflation reached 8.8%. Spending fell -$2.95B (-9.0%) but the amount of Vet Services sold fell 16.4%. In 2023 inflation was 9.4% but Vet Care is needed so spending grew $5.95B (+20.0%) – with inflation, +9.7%. In 2024, inflation slowed to 7.4% and the lift was still $5.60B, +15.7%. With inflation, it was really +7.7%.

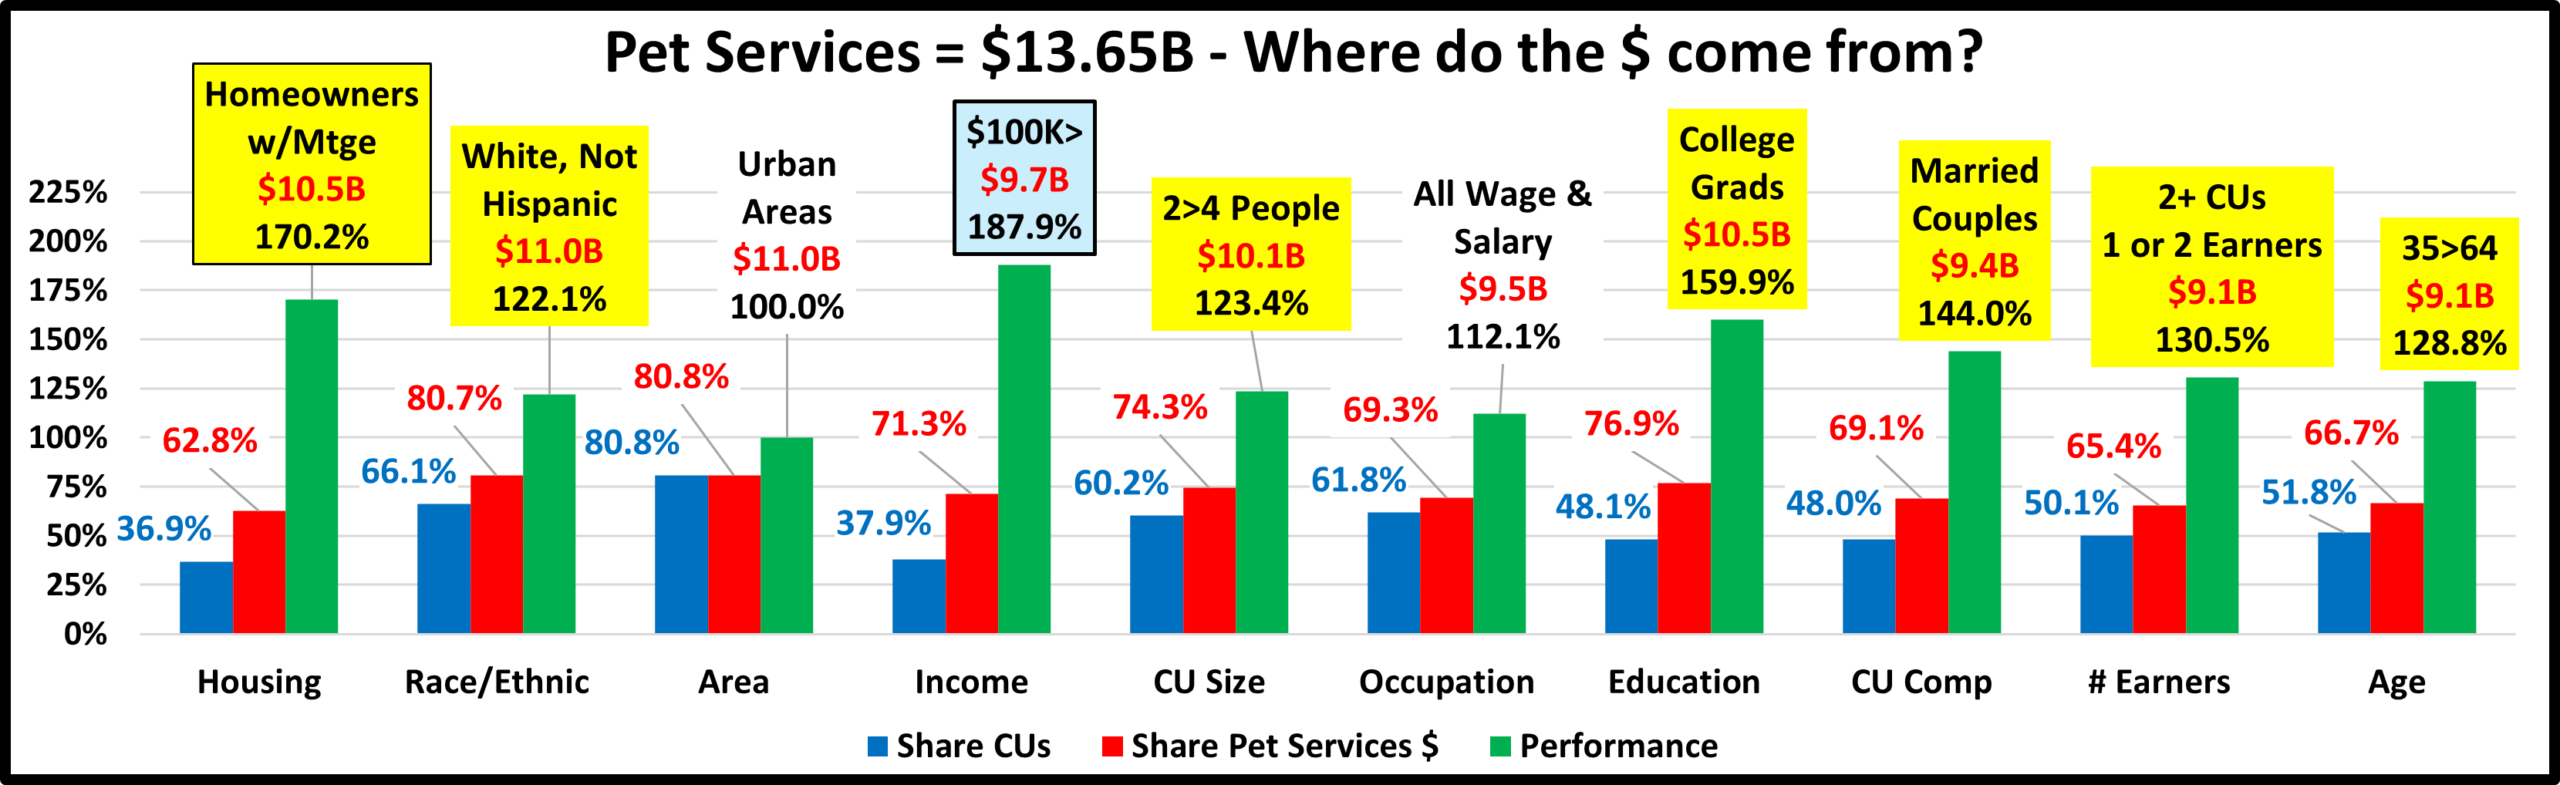
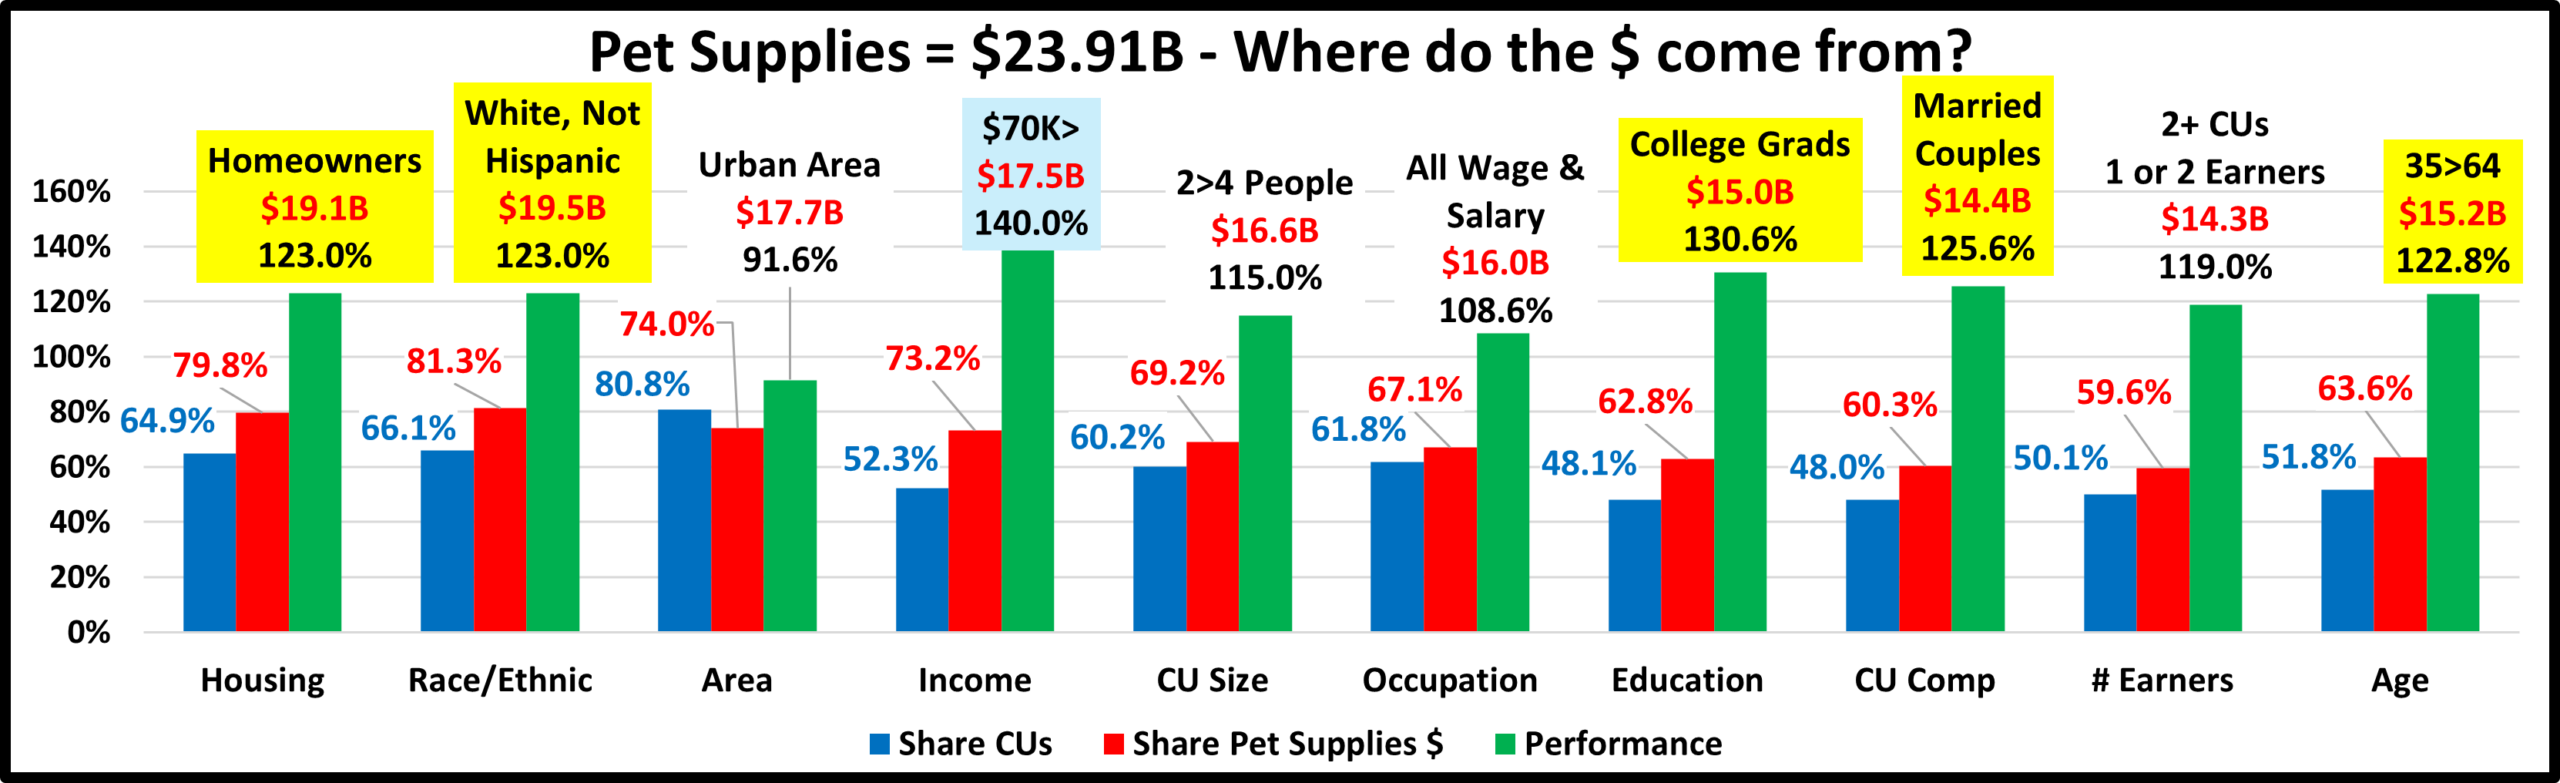
We’ll start with the groups who were responsible for most of Vet spending in 2024 and the $5.6B increase. The 1st chart details the biggest Vet spenders for 10 demographic categories. It shows share of CU’s, share of Vet spending and their performance (Share of spending/share of CU’s). In performance – 7 groups perform at 120+%, 2 more than 2023 & 1 more than 2018>2021. This is also 1 more than Supplies, 2 more than Food, but 1 less than Services. These big spenders are performing well but it also signals that there is still disparity between the best and worst performing demographics in this “needed” segment. Only the CU Size & Income groups are different from Total Pet and the categories are listed in the order that reflects their share of Total Pet $pending. Again, High Income is the most important factor in Spending.

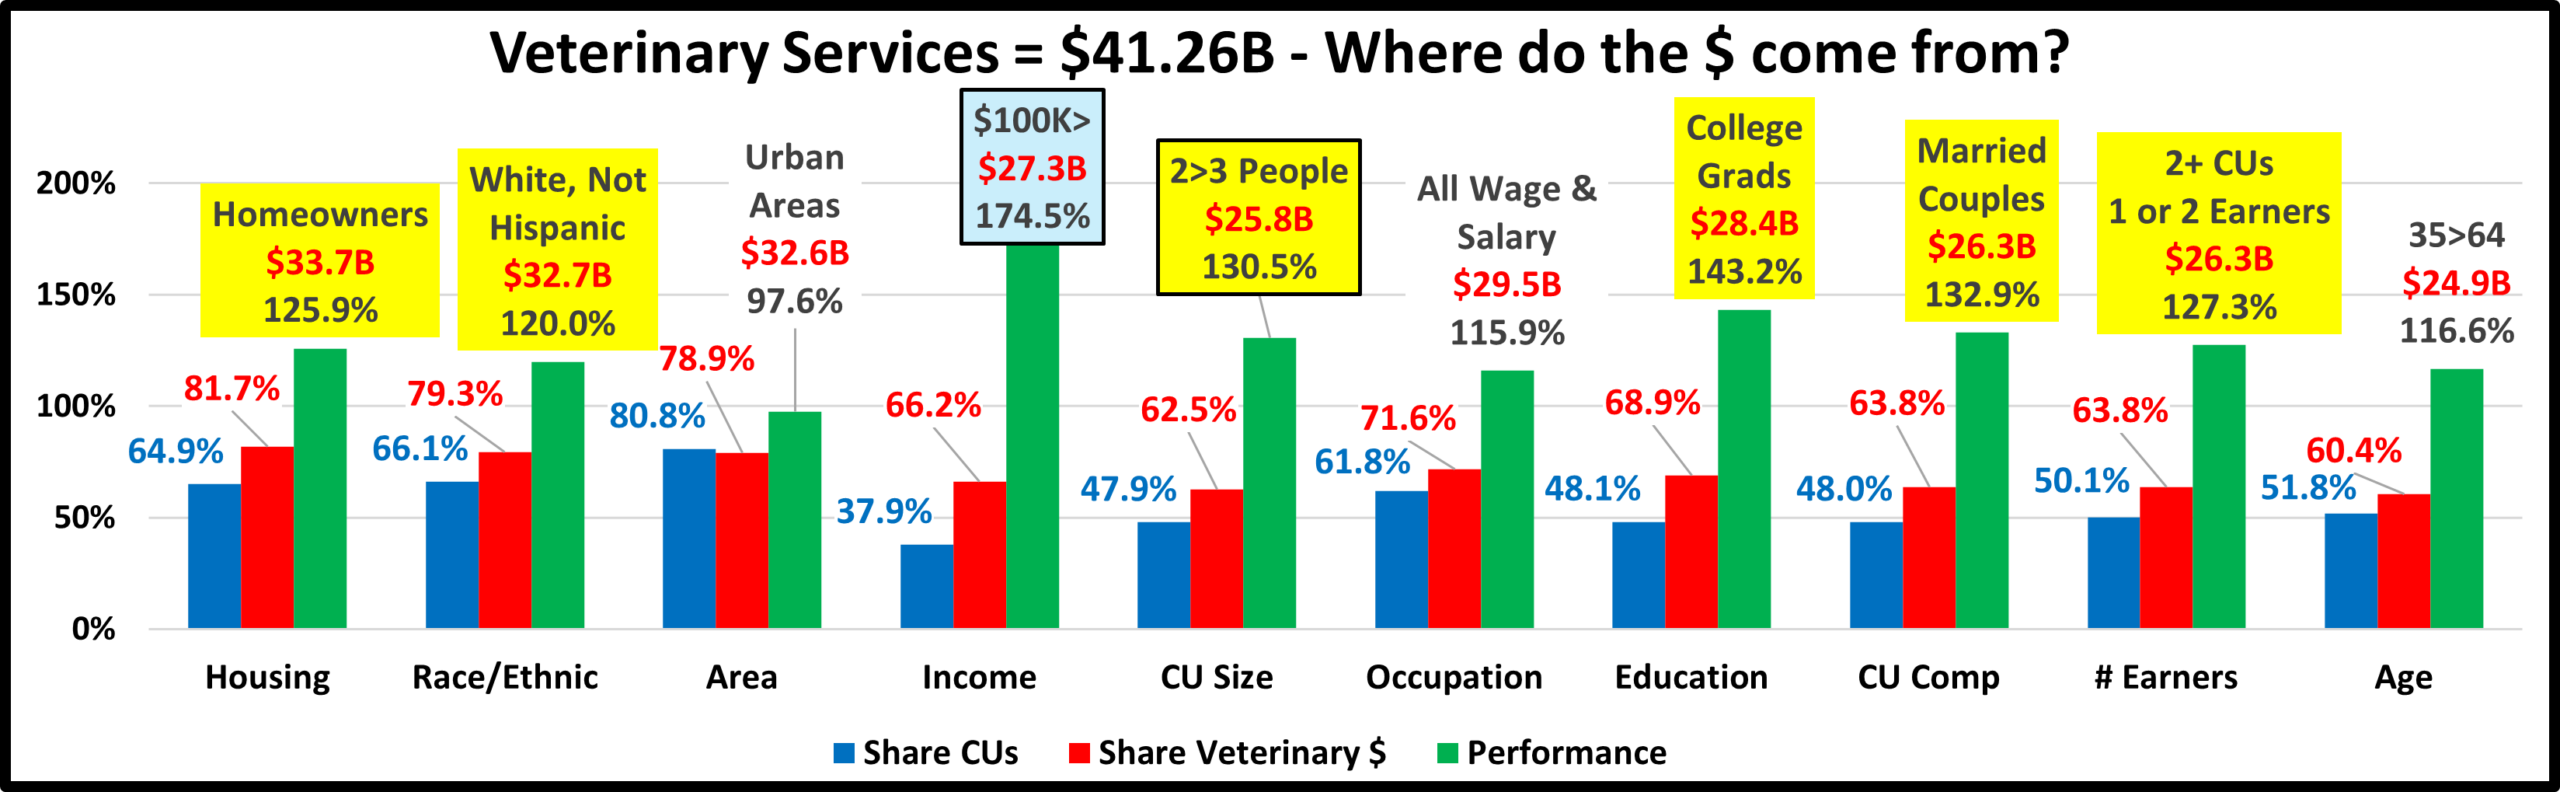
  1. Housing – Homeowners (81.7%) up from 81.2% Homeownership is a major factor in pet ownership and spending in all industry segments. In terms of importance to Veterinary spending, their 125.9% performance rating is up from 124.8%, but they dropped to 6th from 5th place in importance. Only Homeowners w/o Mtge spent less. Renters were +12.5% while All Homeowners were +16.5%. This produced the small gains in share & performance for Homeowners. We should also note that Homeownership is definitely not as important to Veterinary Spending as it once was. In 2015 their share was 88.4% with performance of 141.8%.
  2. Race/Ethnic – White, not Hispanic (79.3%) down from 84.7%. This group accounts for the vast majority of spending in every segment but lost share in Vet $ again in 2024. Their 120.0% performance is also down from 127.6% and they fell from #4 to #7 in importance in Veterinary Spending. All spent more, but the Minority increase was +56.4%, while Whites were up +8.4%. This caused the drops in share and performance.
  3. Area – Urban Areas (78.9%) down from 79.0% Suburban CU’s are the biggest spenders in every segment. All areas spent more and the lifts were in double digit % and very close in size. The Rural lift was slightly bigger. This explains why the drop in share was so small and caused their performance to stay at 97.6%. They’re still last in importance.
  4. Income – Over $100K (66.2%) up from 61.1% Their performance also grew from 167.7% to 174.5%. Higher income is still the most important factor in Veterinary spending. The only drops were $30>49K, -$0.27B and $70>149K, -$0.18B. The $150K> groups spent $5.68B more. This drove the big lifts in share and performance.
  5. # in CU – 2 or 3 People (62.5%) up from 61.9% This smaller group had a slight gain in share and their performance grew from 129.8% to 130.5%. CU Size’s rank in importance in Vet Spending moved up from #7 to #4. All but Singles, -$0.01B, spent more. 2/3 People CUs were +$3.69B, 66% of the overall lift in Vet Spending.
  6. Occupation – All Wage & Salaried (71.6%) up from 68.6% and their performance increased from 112.6% to 115.9%. In the group, all spent more. Outside the group, only Retirees, -$0.83B, spent less. White Collar workers spent $4.52B, +22.3% more. They drove the lifts in share in performance. Mgrs/Prof had the biggest lift, +$3.89B. We should also note that their perfomance lift was slowed a little because they had 1.9 million more CUs than in 2023.
  7. Education – College Grads (68.9%) up from 64.9%. Income generally increases with education. It is also important in understanding the need for regular Veterinary care. Their performance also increased from 135.8% to 143.2% and they stayed #2 in importance. Only <HS Grads & HS Grads w/some College spent less in 2023. College grads (48.1% of CUs) generated 94.6% of the 23>24 lift, which drove the increases in share and performance.
  8. CU Composition – Married Couples (63.8%) up from 61.5% Their performance also rose to 132.9% from 127.7% and they stayed #3 in importance. Only Married, +Adults, No kids, Single Parents & Singles spent less. The lifts in share and performance were due to All Married being +$4.39B, +20.0%.
  9. # Earners – 2+ CUs, 1 or 2 Earners (63.8%) up from 60.2% Their Performance also grew from 119.9% to 127.3%.  # Earners moved up from #6 to #5 in importance. Only No Earner CUs of any size spent less. 2 Earners, +$4.61B, +29.4%, drove the group’s lifts in share and performance.
  10. Age – 35>64 (60.4%) down from 60.8% Their performance also slowed a little from 116.7% to 116.6% but they stayed 8th in importance. Only 55>64, -$0.34B & 65>74, -$0.09B spent less. The 54>64 drop along with a +$2.13B lift by <35 were the big factors in the Group’s minor drops in share and performance.

Spending disparity rose in 6 categories. The average group performance was 128.4%, up from 125.4% in 2023 so spending became less balanced. Notably, a smaller group size made CU Size & # Earners more important. However, the 3 most important groups, $100K> Income, College Degrees & Married Couples are the same as 2023.

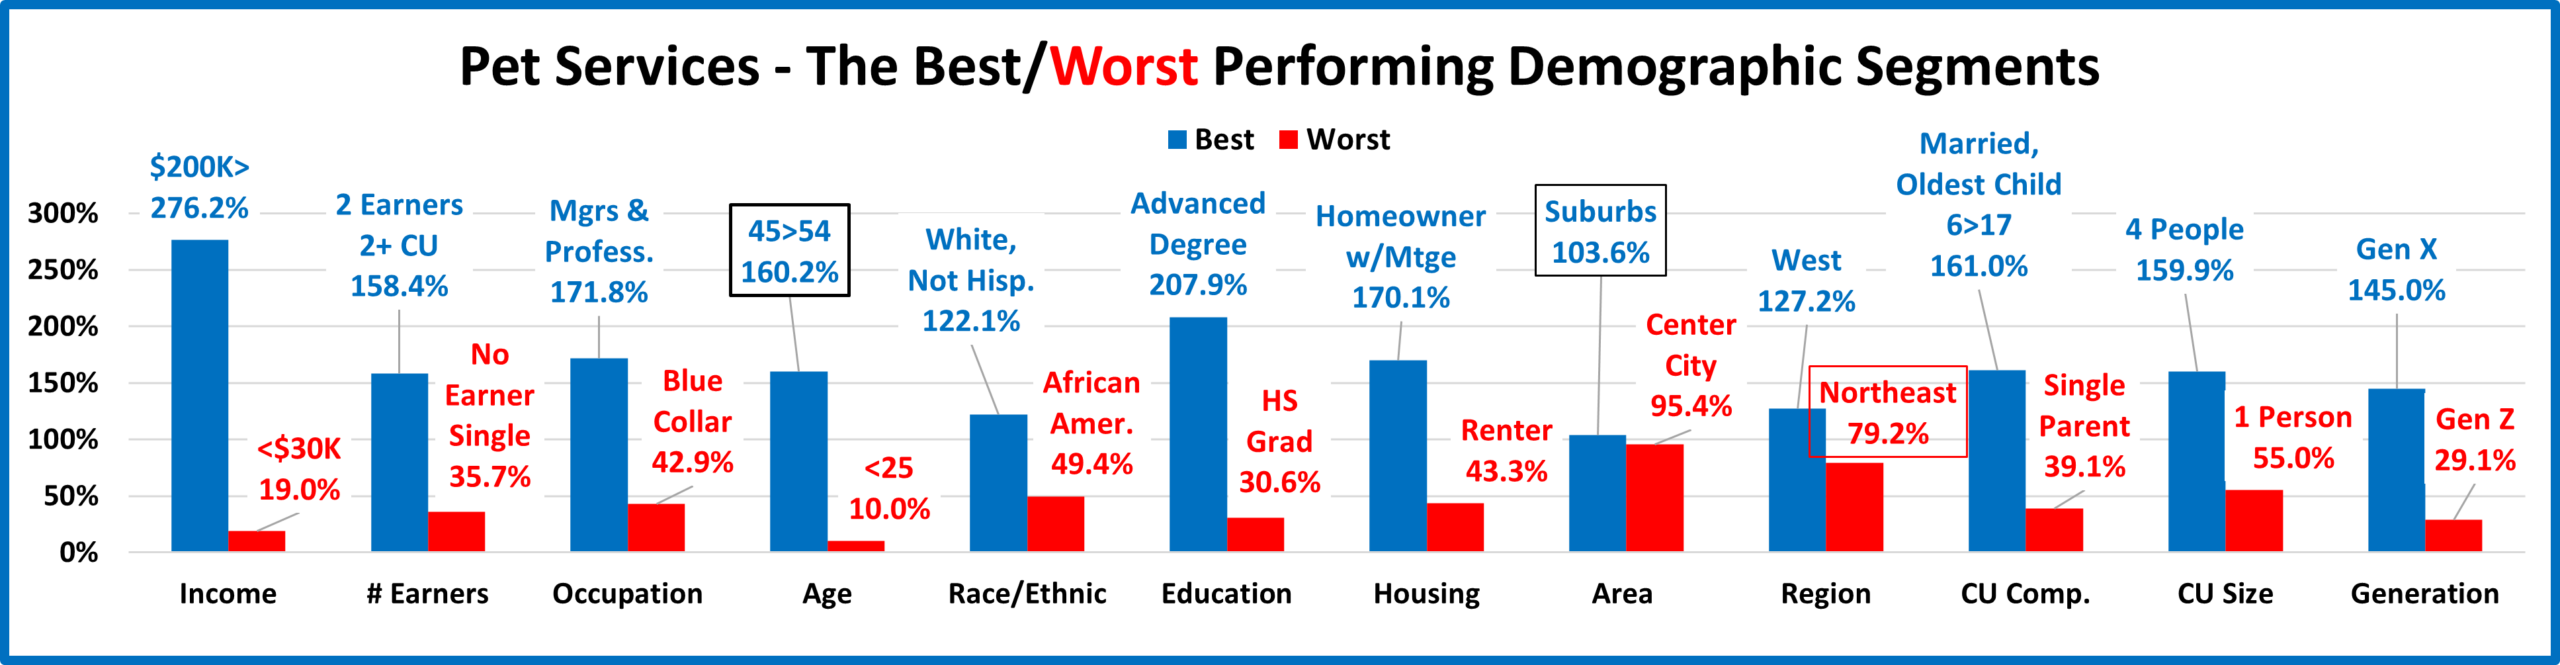
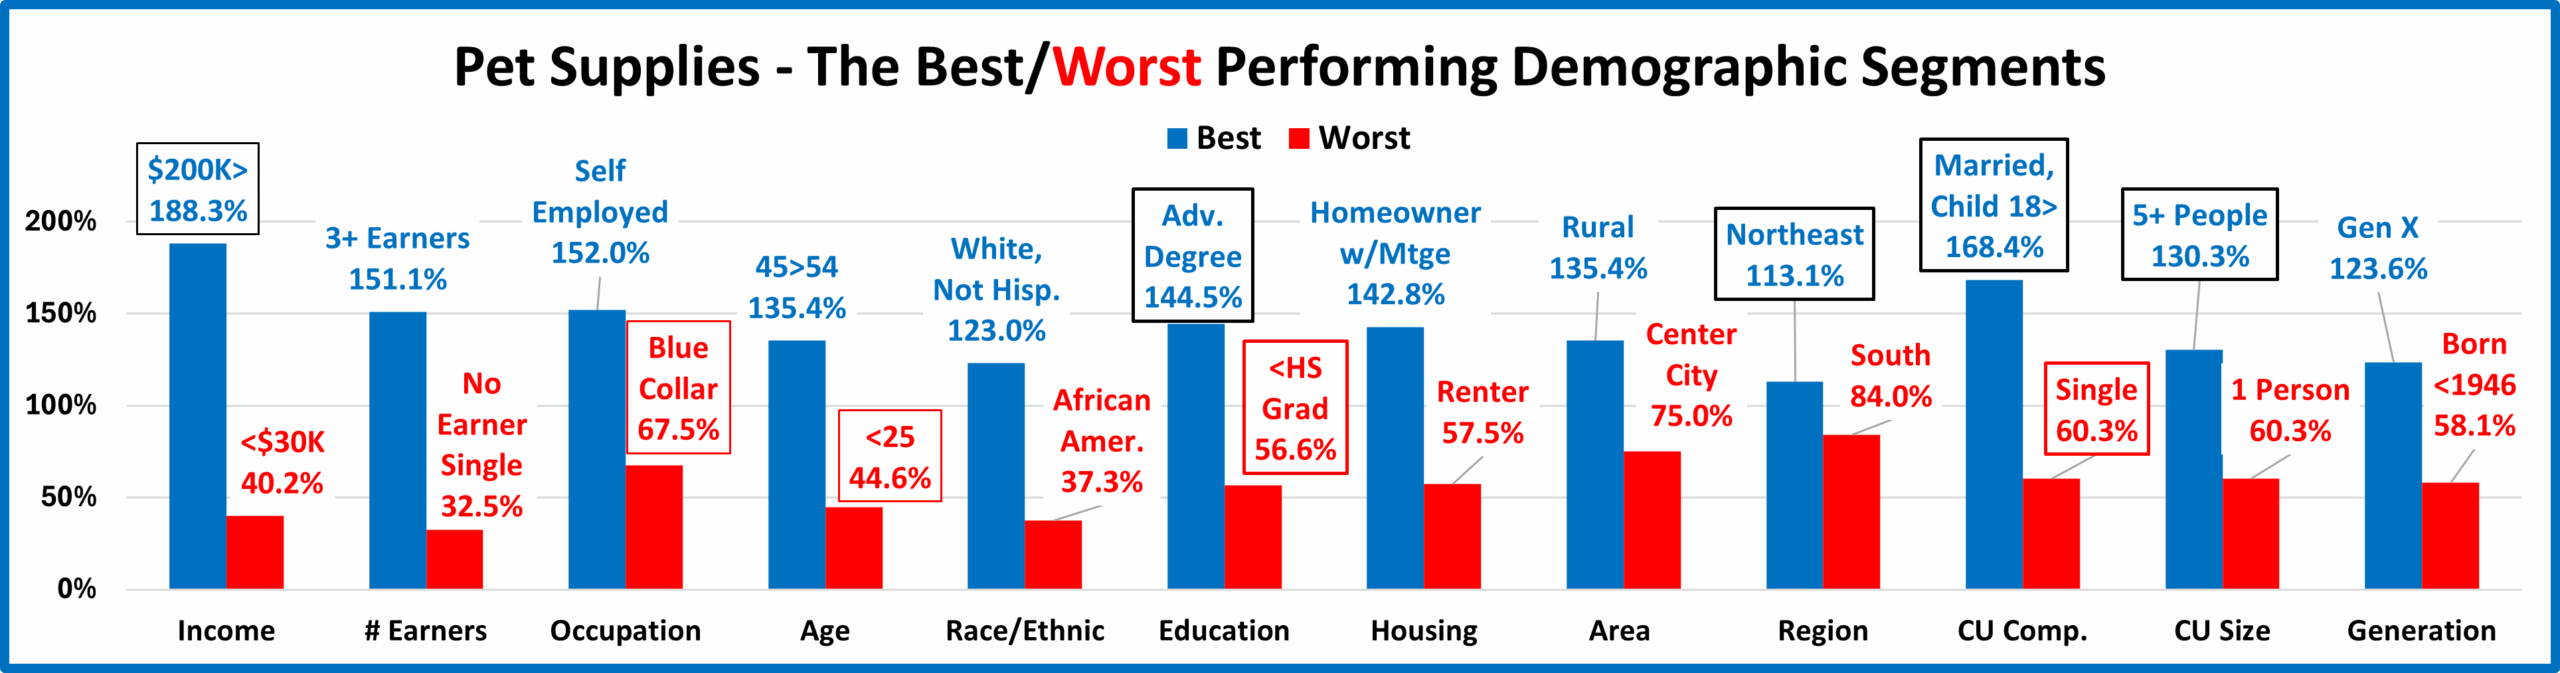
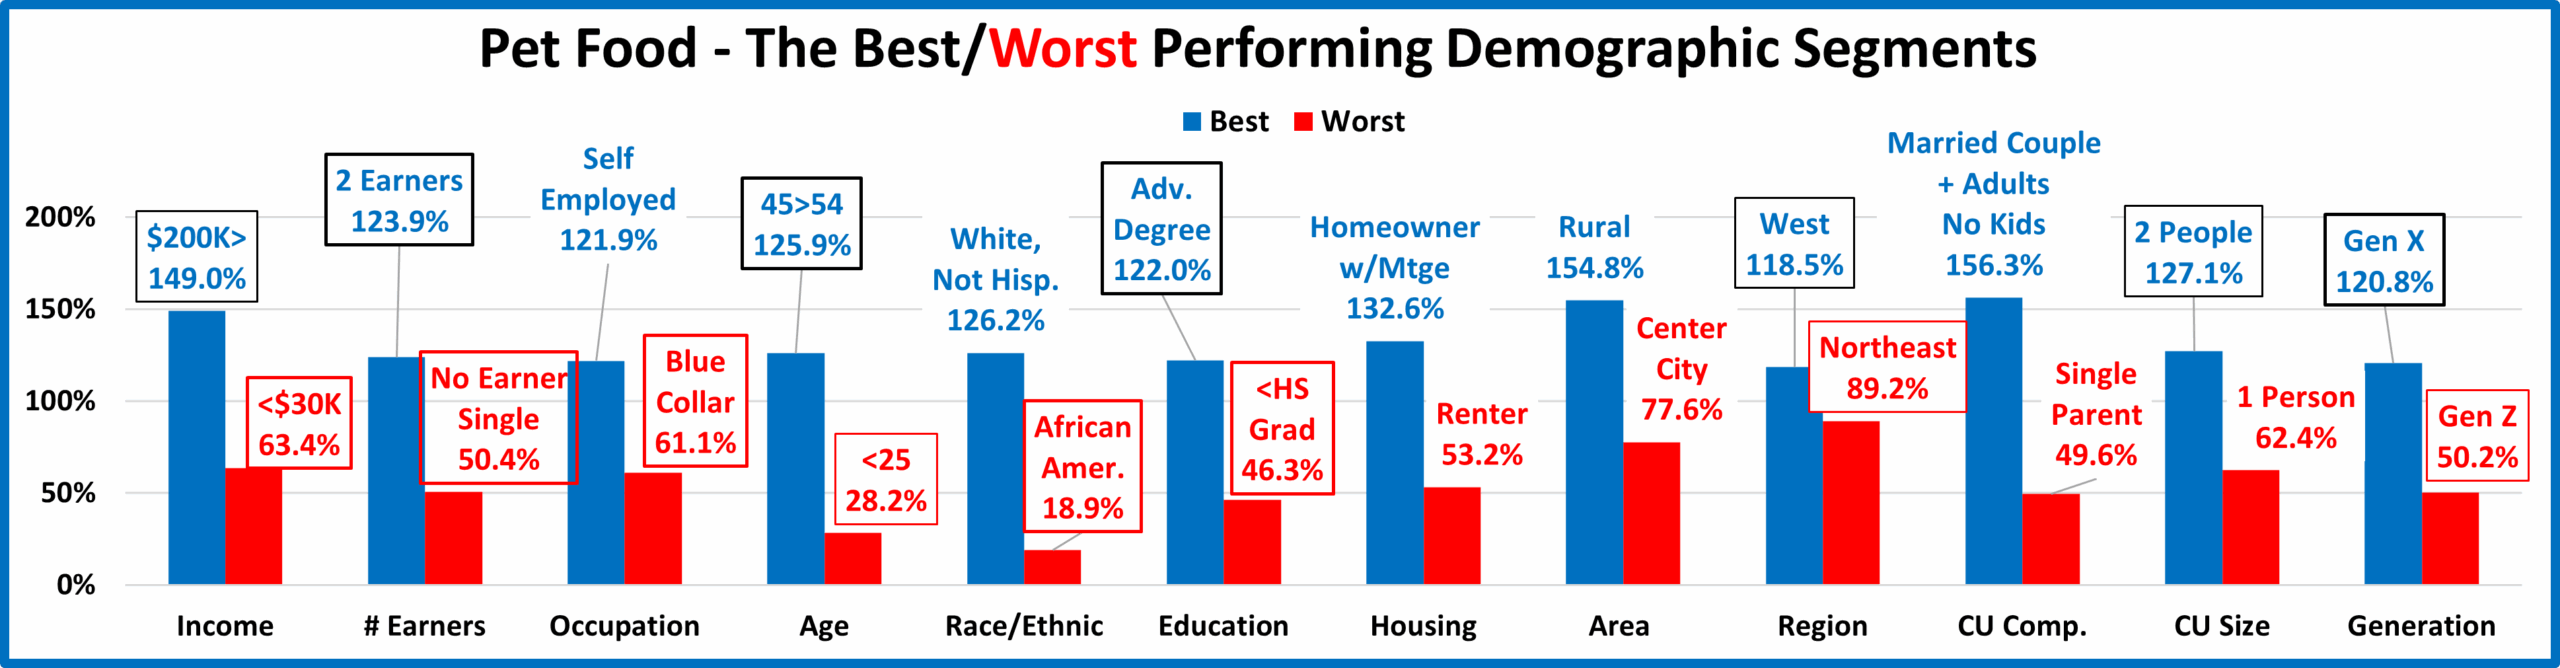
Now, we’ll look at 2024’s best and worst performing Veterinary spending segments in each category.

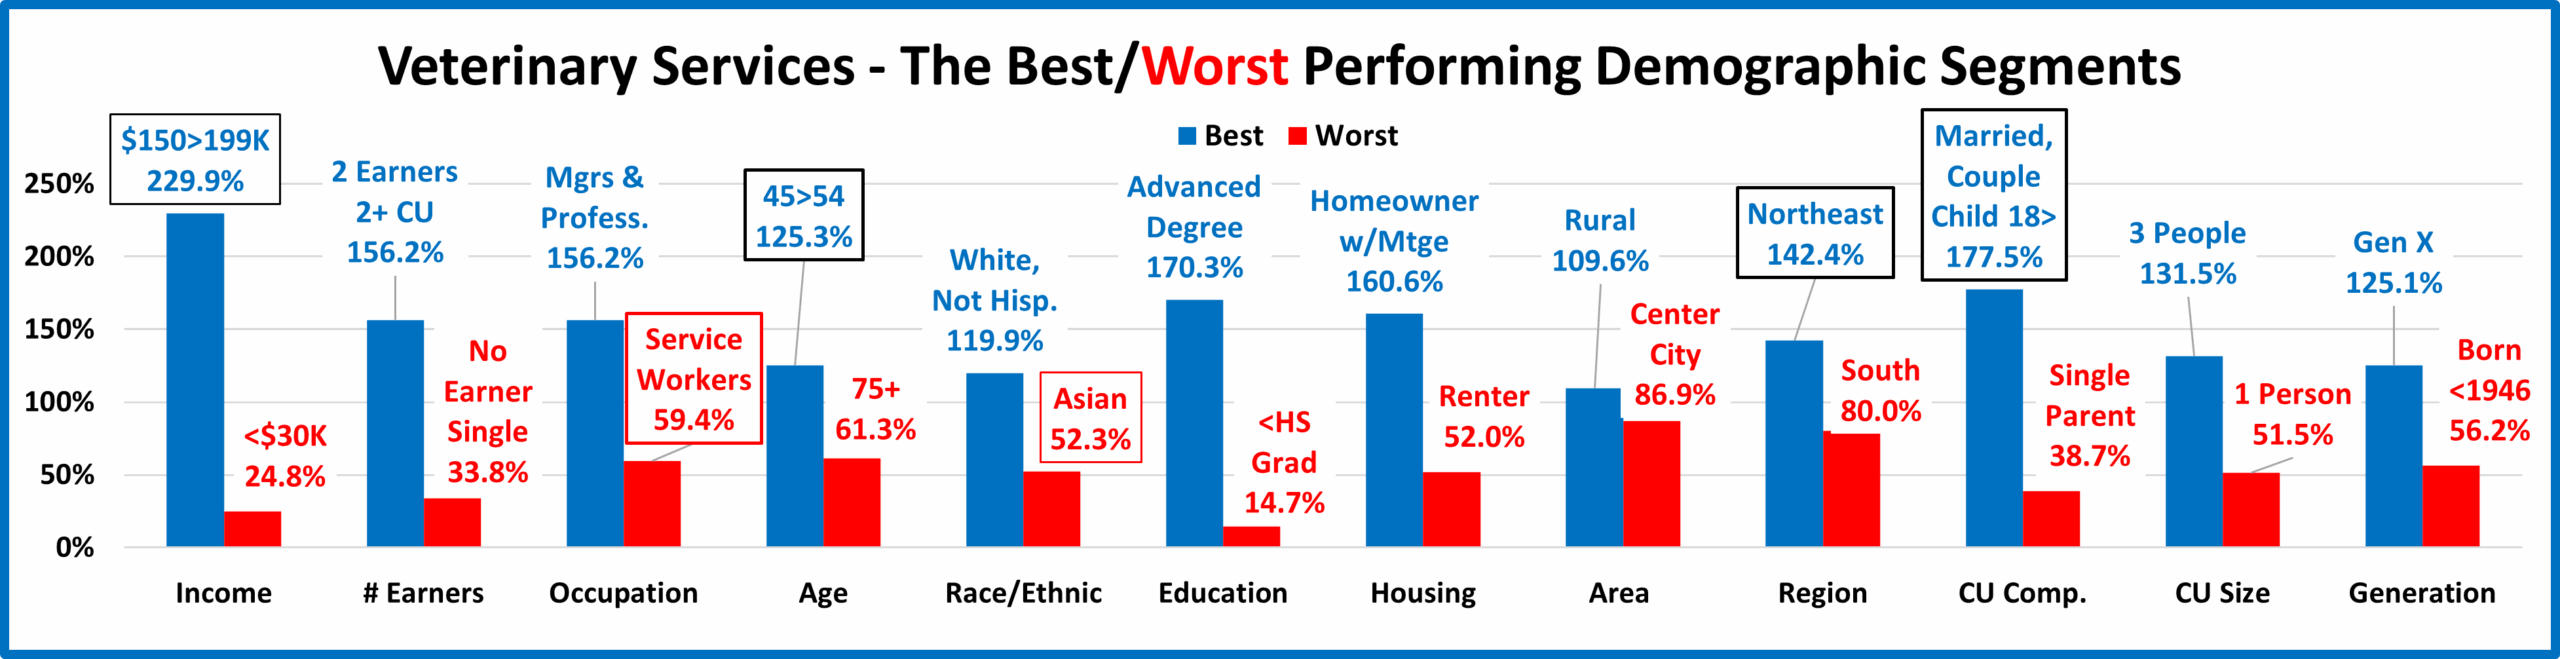
There are no surprising winners or losers but 6 are different from 2023, down from 9 last year. This is 3 more than Services, but 3 less than Supplies and 9 less than Food. Also, the average difference between Best & Worst was 99.4%, much more than 89.8% in 2023. There was considerable turmoil and 9 of 12 categories had increased disparity. The average difference grew considerably, so spending was less balanced. Changes from 2023 are “boxed”. We should note:

  • Income– The Winner changed from $200K>. The gap is 205.0%, 30% more than 2023.
  • Earners – No change in Winner or Loser, but the gap widened by 22.7%.
  • Occupation – Service Workers replaced Blue Collar at the bottom but the gap only widened by +0.7%.
  • Age – 45>54 replaced 55>64 yr-olds on top and the gap narrowed by -3.9%.
  • Race/Ethnic; Asians replaced African Americans on the bottom. The gap narrowed a lot, -35.3%.
  • Education; Housing; Area – These all had an expected repeat winner & loser and the performance gap increased for Education: +24.6%; Housing: +20.4%; Area: +1.3%.
  • Region – Northeast replaced West at the top. The South has now finished last for 9 years in a row, but the win/lose gap increased by 9.1%. Also, just 2 regions performed at 100+%, down from 3 in 2023.
  • CU Composition – Married, Child 18> replaced Couple Only on top. The gap widened, +42.7%.
  • # in CU – No changes, but the gap grew by +5.7%. Only 1 & 5+ people CUs perform below 100%.
  • Generation – No changes and the performance gap narrowed by -2.3%.

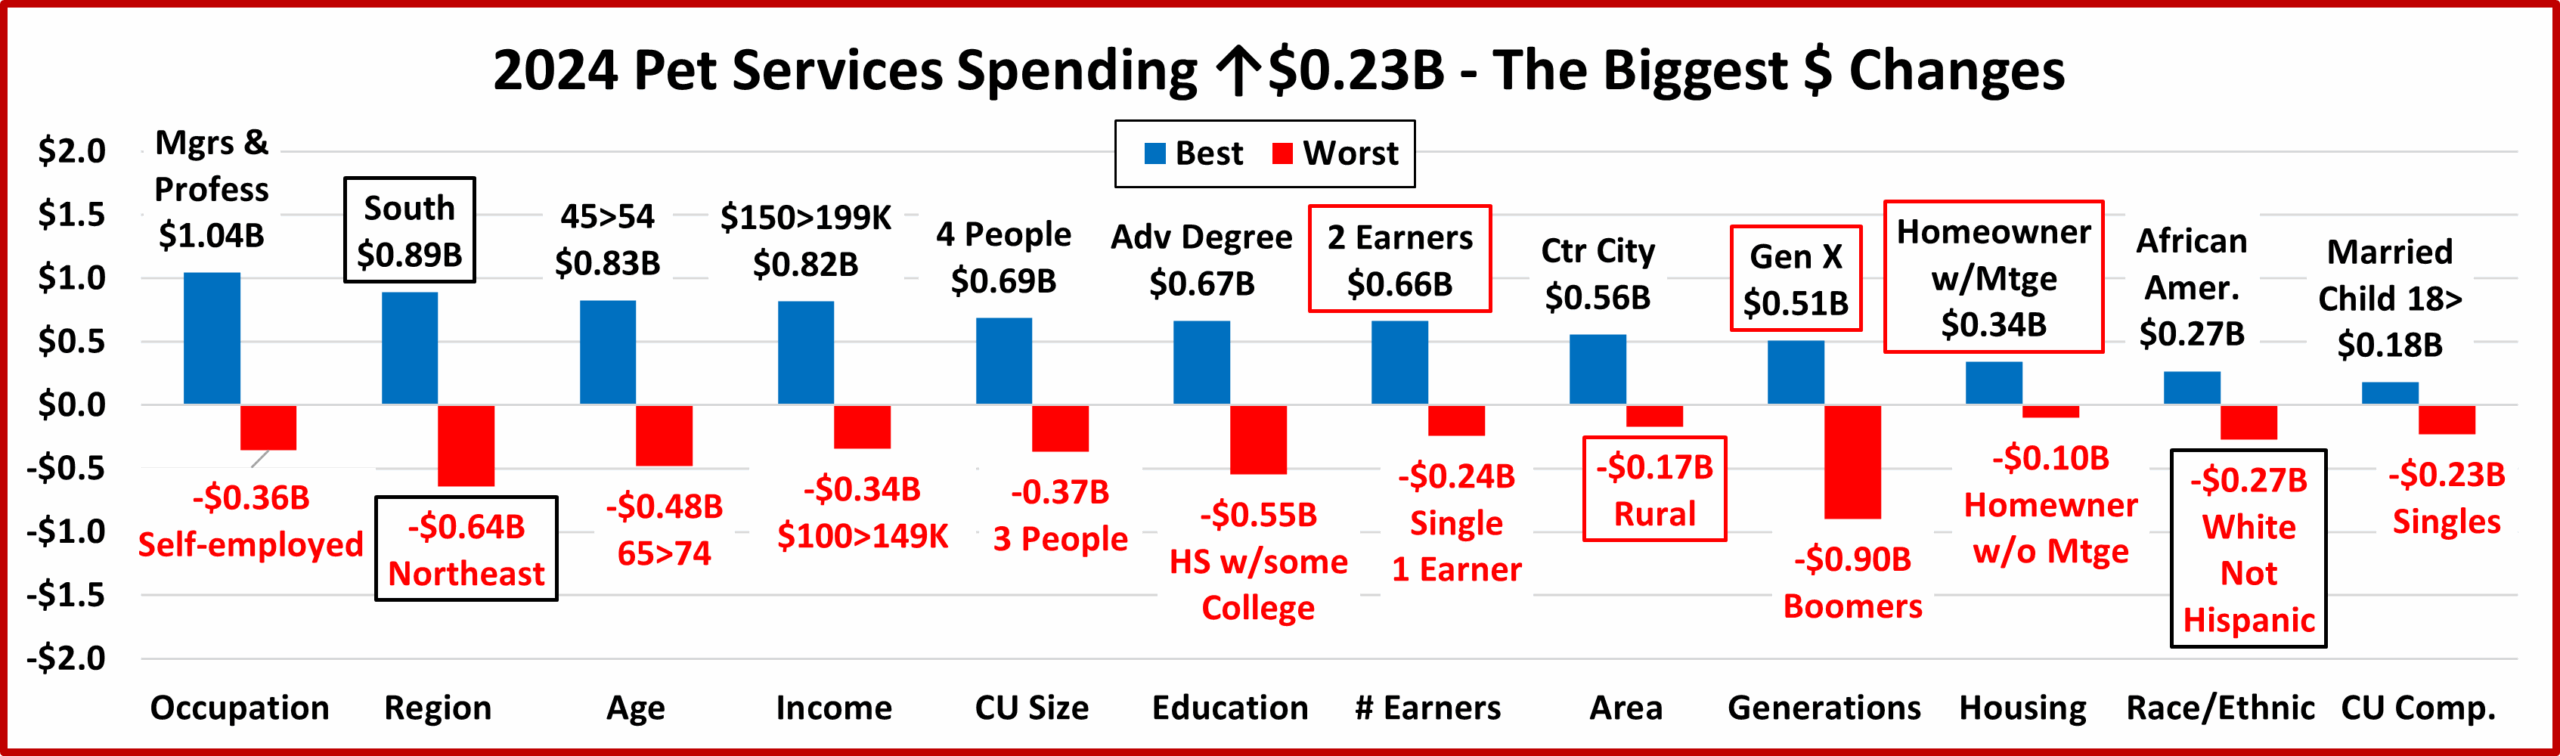
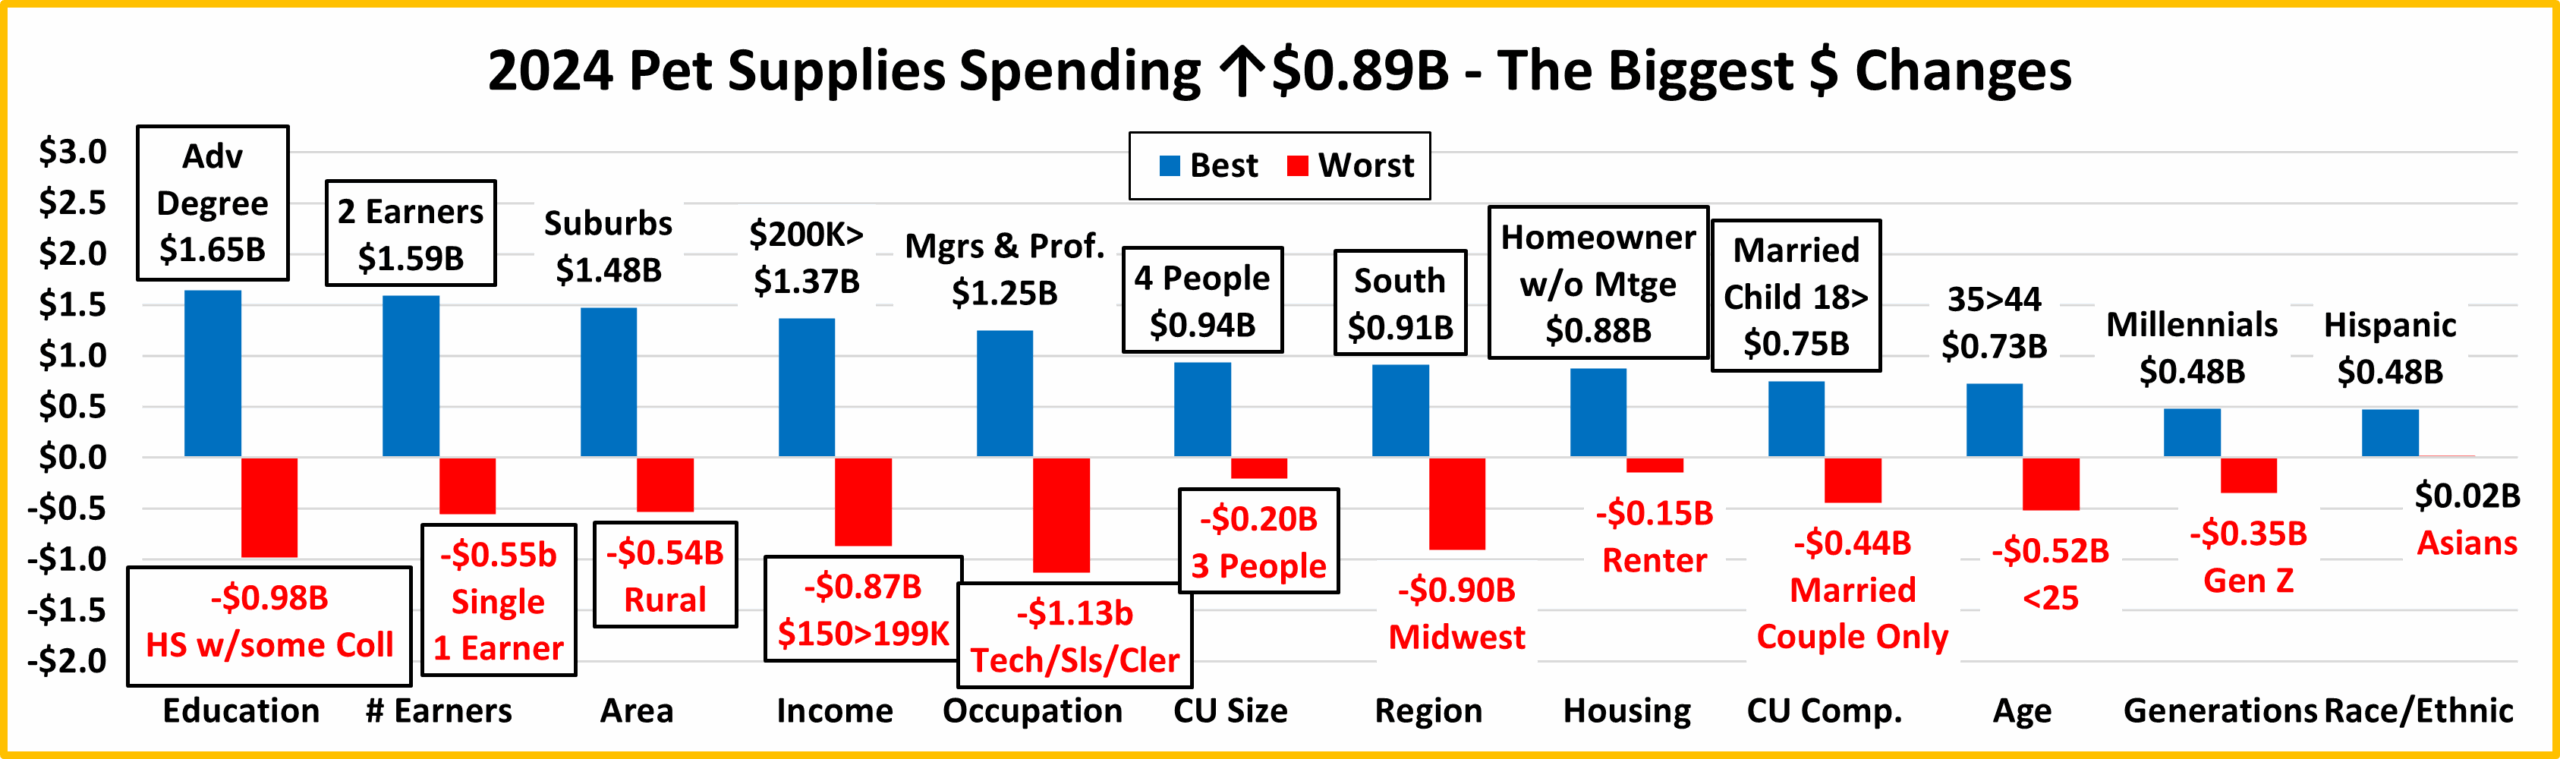
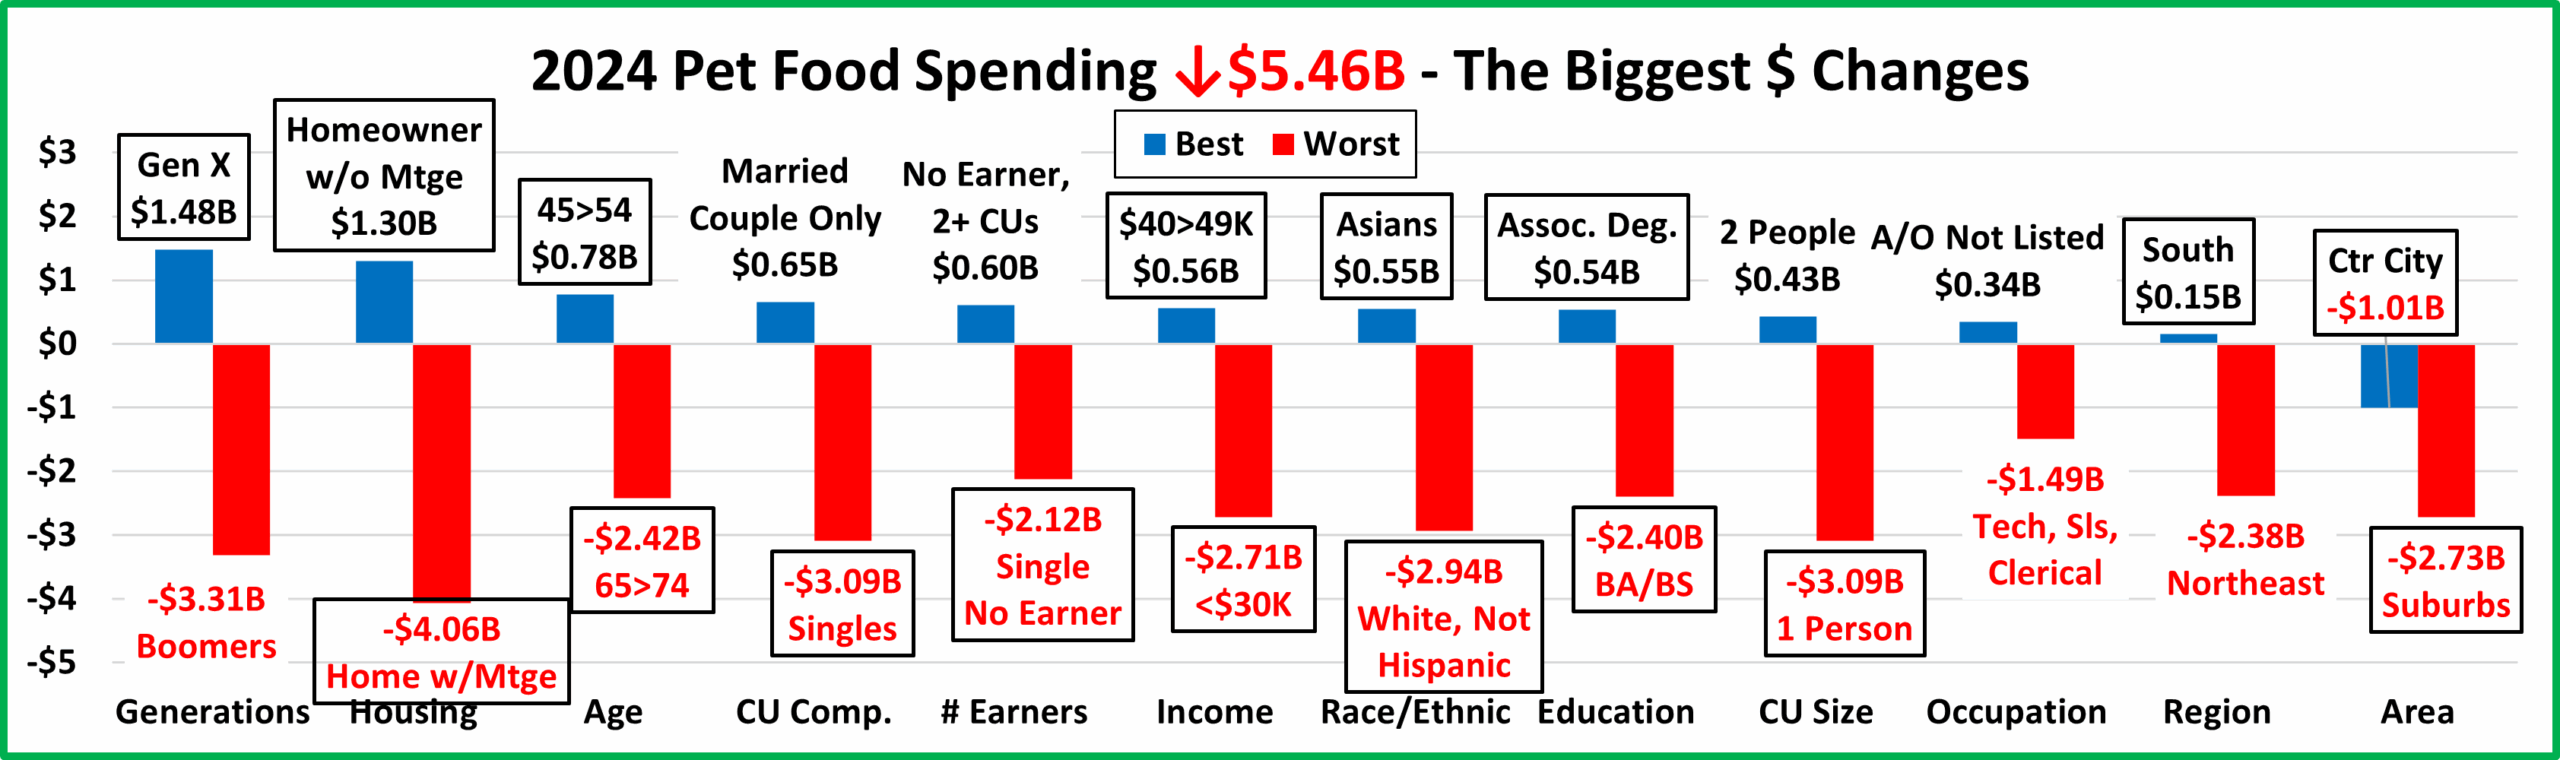
It’s time to “Show you the money”. Here are segments with the biggest $ changes in Veterinary Spending.

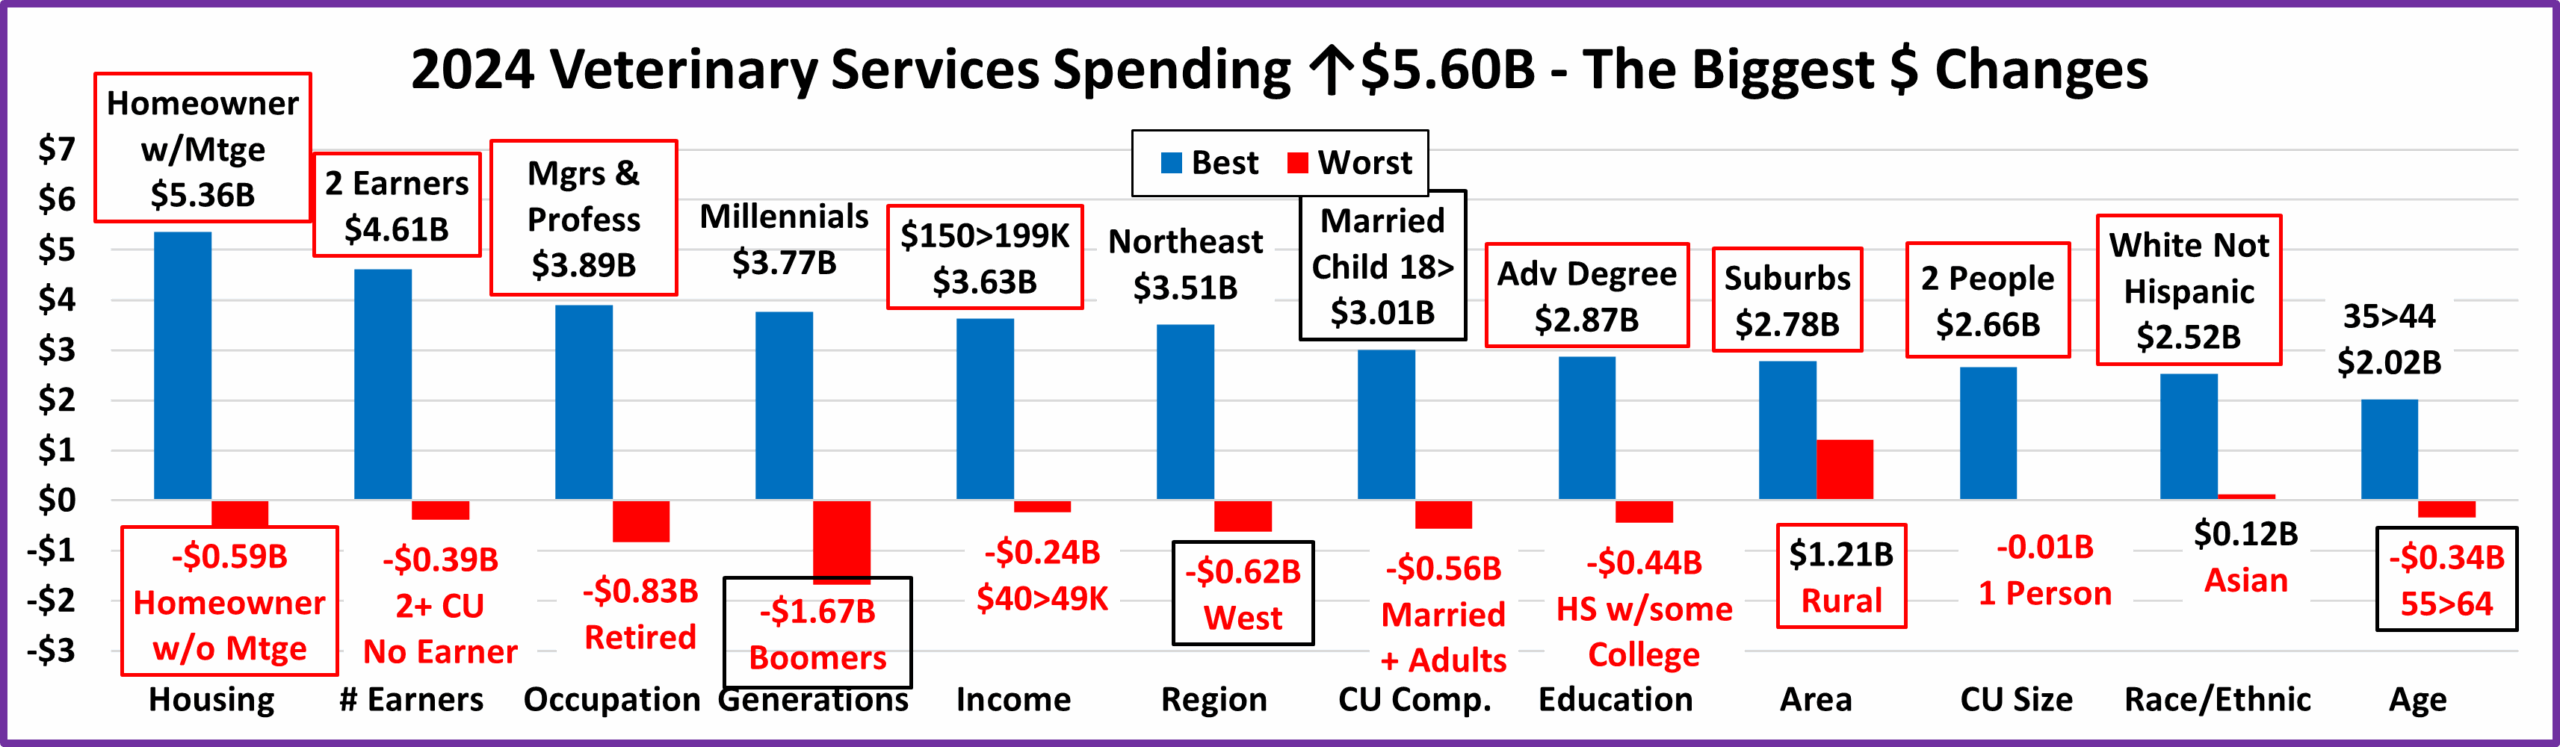
We saw some turmoil in performance. It lessens here. There were 10 repeats, and 4  segments flipped from 1st to last or vice versa. Last year there was 1 repeat and 13 flips. There were no truly surprising winners and there were only 2 somewhat surprising losers – Boomers & the West. In 2024 there were 2 categories in which all segments spent more. In 2023, there were 4. Plus, in 2023, 82.3% of 96 demographic segments spent more. In 2024, that slowed a little to 81.3%. If you consider 7.4% inflation, 69.8% still spent more in 2024.

  • Housing – Homeowners w/Mtges stayed on top and those w/o Mtges stayed on the bottom.
    • Winner – Homeowner w/Mtge – Veterinary: $24.46B; Up $5.36B (+28.0%)                                        2023: Homeowner w/Mtge
    • Loser – Homeowner w/o Mtge – Veterinary$: $27B; Down $0.59B (-6.0%)                                         2023: Homeowner w/o Mtge
    • Comment – In 2023, all segments spent more. In 2024, only Homeowners w/o Mtge spent less. Renters were +$0.84B, +12.5+. They account for 35.1% of CUs but only 18.3% of Veterinary spending, 52.0% performance. All Homeowners were +$4.77B, +16.5% and had 125.9% performance.
  • # Earners – 2 Earners won again while No Earner, 2+ CUs replaced No Earner, Singles as the loser.
    • Winner – 2 Earners – Veterinary Spending: $20.30B; Up $4.61B (+29.4%)                                            2023: 2 Earners
    • Loser – No Earner, 2+ CU – Veterinary Spending: $3.03B; Down $0.39B (-11.3%)                               2023: No Earner, Single
    • Comment – Only No Earner CUs spent less. The 2nd largest lift was +$1.13B by 3+ Earner CUs. We should note that the increase by 1 Earner, Singles was only +$0.01B.
  • Occupation – Mgrs/Prof won again but Retirees replaced Blue Collar on the bottom.
    • Winner – Mgrs & Professionals – Vet Spending: $18.66B; Up $3.89B (+26.4%)                                      2023: Mgrs & Professionals
    • Loser – Retired – Vet Spending: $6.08B; Down $0.83B (-12,0%)                                                                 2023: Blue Collar
    • Comment – Only Retirees spent less. Amazingly, All Other, Unemployed had the 2nd biggest lift, +$0.79B. White Collar workers were +$4.52B, 80.7% of the Veterinary increase from 42.4% of CUs.
  • Generation – Millennials are a new winner. Boomers flipped to the bottom.
    • Winner – Millennials – Veterinary: $12.99B; Up $3.77B (+40.8%)                                           2023: Baby Boomers
    • Loser – Baby Boomers – Veterinary: $10.27B; Down $1.67B (-14.0%)                                   2023: Born <1946
    • Comments – Only Baby Boomers spent less. This comes after a +$2.21B lift in 2023. Millennials were more consistent. In 2023, they finished a close 2nd to the Boomers, +$2.09B. In 2024, they led the charge. Gen X is the most consistent. 23>24: +$2.34B; 22>23: +$1.13B; 21>22: +$0.46B (Note: Vet $ were -$2.95B in 2022.)
  • Income – $150>199K stayed on top and $40>49K replaced <$30K at the bottom.
    • Winner – $150>199K – Veterinary Spending: $8.98B; Up $3.63B (+67.9%)                                     2023: $150>199K
    • Loser – $40>49K – Veterinary Spending: $1.52B; Down $0.24B (-13.4%)                                        2023: <$30K
    • Comment – Only the $30>49K, $70>99K & $100>149K groups spent less. All big groups, under/over $70K & $100K had increases. The $150K> group drove the lift. They were +$5.68B (101% of the total Vet increase)
  • Region – The West flipped to the bottom and the Northeast replaced them on top.
    • Winner – Northeast – Veterinary Spending: $10.23B; Up $3.51B (+52.3%)                                    2023: West
    • Loser – West – Veterinary Spending: $9.69B; Down $0.62B (-6.0%)                                                2023: Midwest
    • Comment – All Regions but West spent more. The 2nd biggest lift was +$2.28B by the South.
  • CU Composition – Married, Oldest Child 18> flipped to the top. Married, + Adults replaced them on the bottom.
    • Winner – Married, Oldest Child 18> – Veterinary: $5.80B; Up $3.01B (+107.8%)                                 2023: Married, Couple Only
    • Loser – Married, + Adults – Veterinary: $1.16B; Down $0.56B (-32.6%)                                                 2023: Married, Child 18>
    • Comment – Single Parents & Singles also spent less. 2023 favored CUs with no children. 2024 had no clear pattern. However, Married, With Children were +$3.78B, +41.6%. The largest % lift by any big group.
  • Education – Adv. College degree stayed on top. HS w/some College replaced HS Grads at the bottom.
    • Winner – Adv. College Degree – Veterinary Spending: $14.72B; Up $2.87B (+24.2%)                               2023: Adv Degree
    • Loser – HS Grads w/some College – Veterinary Spending: $5.11B; Down $0.44B (-8.0%)                       2023: HS Grads
    • Comment – In 2023, only <HS & HS Grads had spending decreases. In 2024, <HS & HS Grads w/some College spent less. Total <College was positive, +$0.30B. College Grads were +$5.30B, +22.9%. BA/BS finished a close 2nd to Adv. Degrees, +$2.43B, +21.5%.
  • Area Type – Both Winner & Loser held their spots.
    • Winner – Suburbs 2500> – Veterinary Spending: $19.99B; Up $2.78B (+16.2%)                                      2023: Suburbs 2500>
    • Loser – Rural – Veterinary Spending: $8.69B; Up $1.21B (+16.1%)                                                             2023: Rural
    • Comment – In 2020 & 2021 all groups spent more. In 2022, all spent less. In 2023 & 2024, all spent more again. Since 2020, all segments have the same spending pattern. In 2024, Center City stayed in 2nd place, +$1.61B, +14.7%. The Suburbs 2500> have the biggest share of Vet $, 48.5% and generated 49.6% of the lift.
  • # in CU – 2 People stayed on top and 1 Person replaced 4 People on the bottom.
    • Winner – 2 People – Veterinary Spending: $17.79B; Up $2.66B (+17.6%)                                       2023: 2 People
    • Loser – 1 Person – Veterinary Spending: $6.39B; Down $0.01B (-0.2%)                                         2023: 4 People
    • Comment: In 2022, all spent less. In 2023, only 4 People CUs spent less. In 2024, it was 1 Person, -$0.01B. 2 People still had the biggest increase but the other lifts were more balanced. 3 people: +$1.03; 4 people: +$1.04B.
  • Race/Ethnic – Whites stayed on top while Asians replaced African Americans at the bottom.
    • Winner – White, Not Hispanic– Veterinary: $32.72B; Up $2.52B (+8.4%)                                           2023: White, Not Hispanic
    • Loser – Asian – Veterinary: $1.11B; Up $0.12B (+12.7%)                                                                        2023: African Americans
    • Comment– All groups spent more – more balance. Minorities were +$3.08B, 55% of the Vet lift. Only Asians had a minor lift. African Americans: +$1.86B, +164.0%; Hispanics: +$1.10B, +32.8%.
  • Age – 55>64 flipped to the bottom. 35>44 replaced them on top. BTW: That’s the 3rd consecutive flip for 55>64.
    • Winner – 35>44 yrs – Veterinary Spending: $8.52B; werUp $2.02B (+31.2%)                                  2023: 55>64 yrs
    • Loser – 55>64 yrs – Veterinary Spending: $7.95B; Down $0.34B (-4.1%)                                          2023: 45>54 yrs
    • Comment: All segments spent more in 23. In 24, 65>74 also spent less, -$0.09B. Spending skewed a little younger. <45: +$4.15B; 45>: +$1.45B. The 2nd biggest lift was +$1.67B by 25>34. #3 was +$1.53B by 45>54.

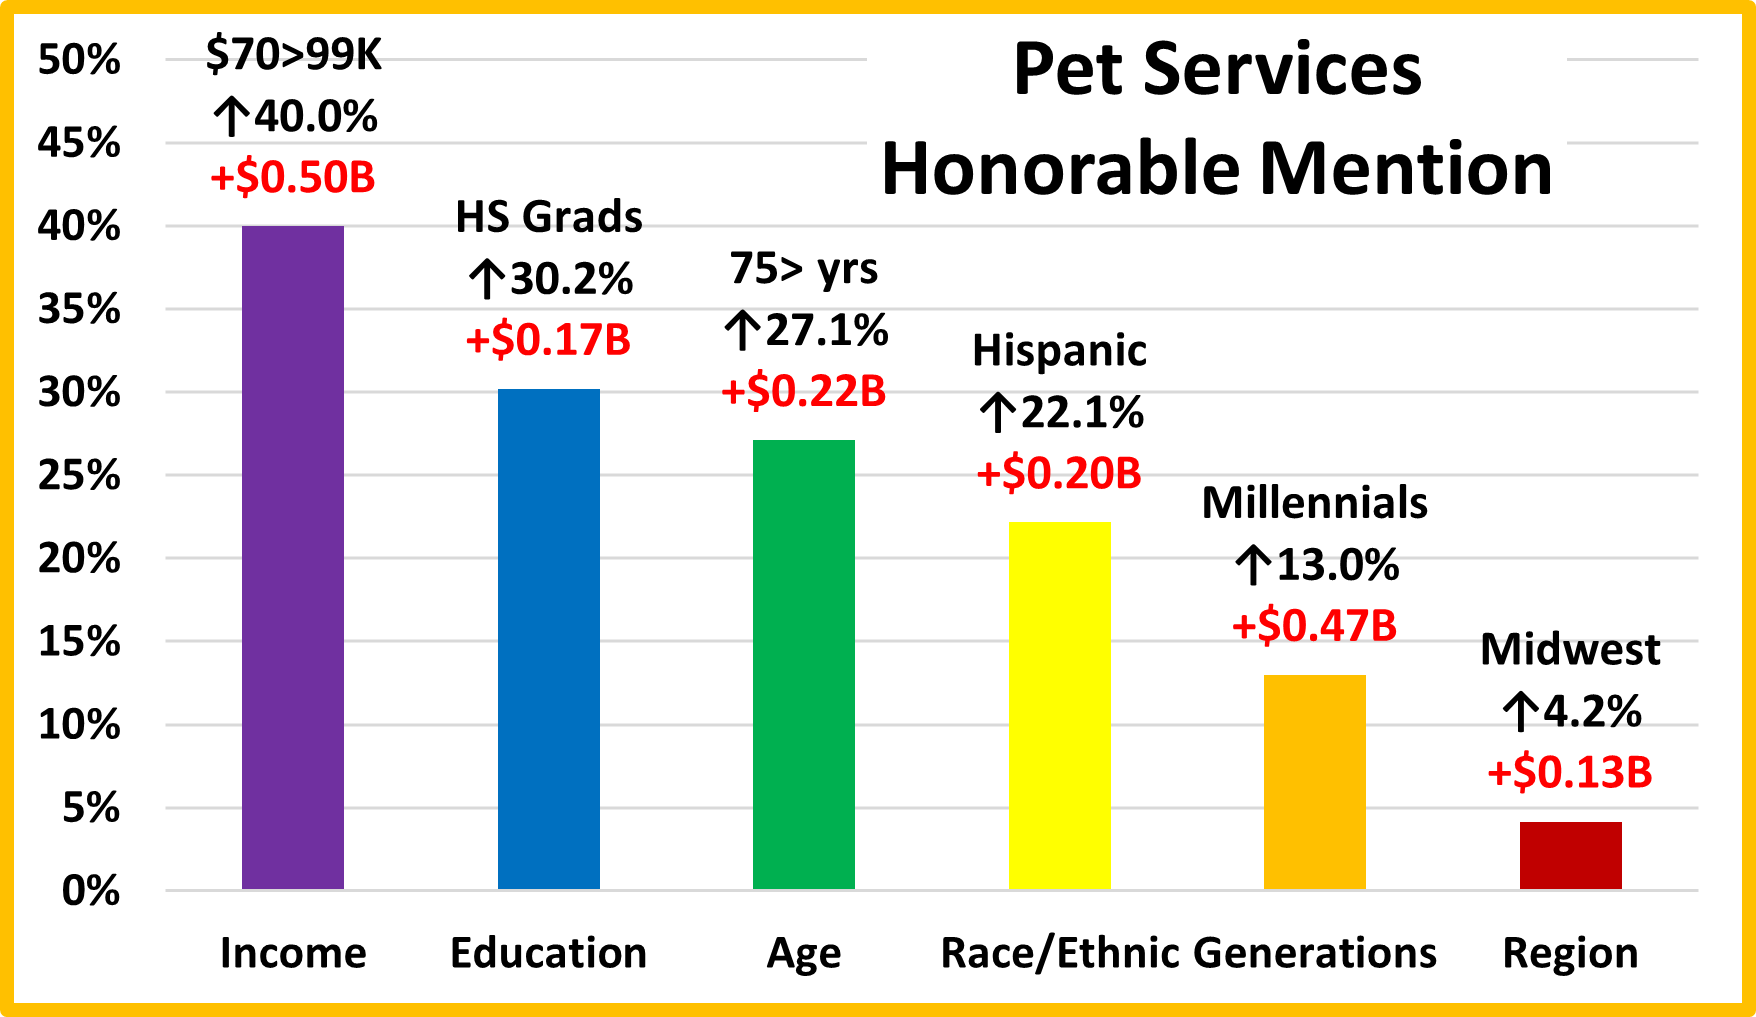
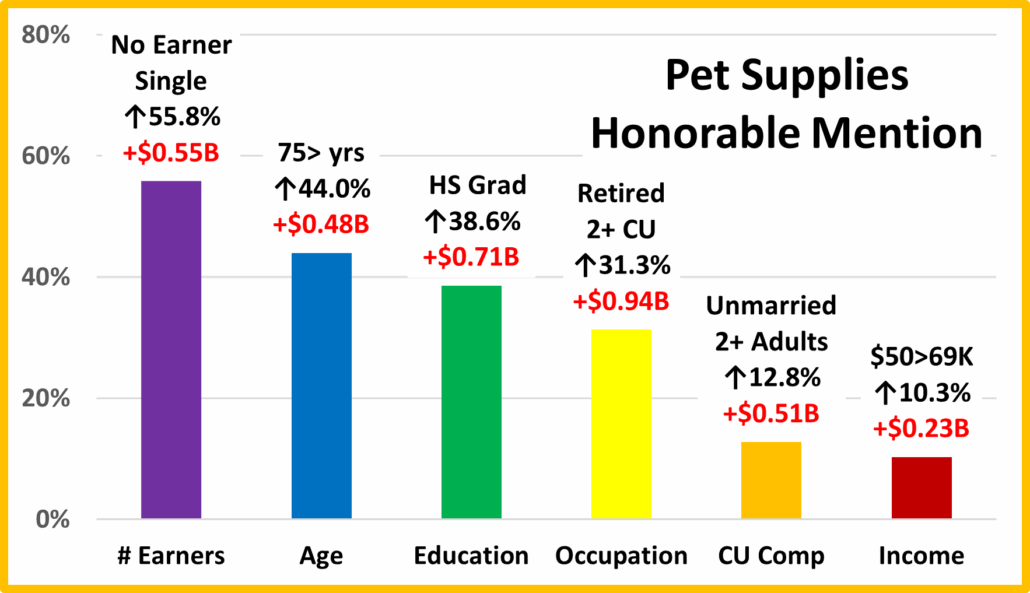
We’ve now seen the winners and losers in terms of increase/decrease in Veterinary Spending $ for 12 Demographic Categories. 2022 had a $2.95B drop. The decrease brought a lot of turmoil in the $ changes. In 2023 there was a huge turnaround as spending rose $5.95B, +20.0% and reached $35.66B. However, the turmoil in $ change continued. In 2024, the big lift continued, +$5.60B, +15.7% to $41.26B. Veterinary Services passed Pet Food and became #1 in spending by Pet Industry Segments. In 2024, in the change chart, 10 held their spot and only 4 flipped from 1st to last or vice versa. In 2023 there was 1 hold and 13 flips. In 2024, there was far less turmoil and greater stability. There were similarities between 2023 & 2024 but 2024 wasn’t always best. In 2023, 82.3% of demographics spent more and there were 4 categories where all segments had increases. In 2024, 81.3% spent more and there were 2 categories where all segments spent more. The “hidden gems” were still easy to find. Here are some segments that didn’t win but helped drive the big lift in Veterinary spending. These groups don’t win an award, but they certainly deserve…
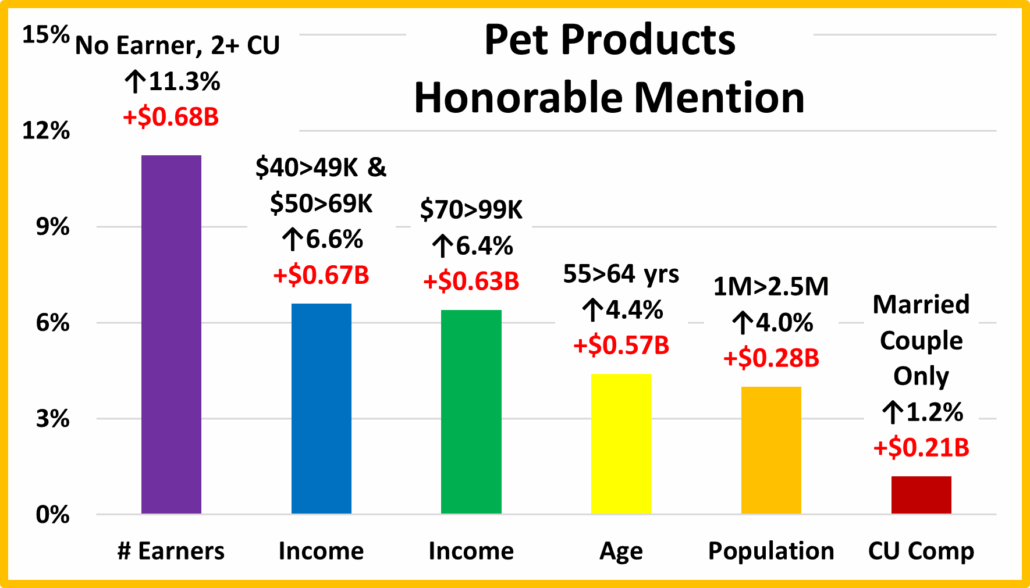
HONORABLE MENTION

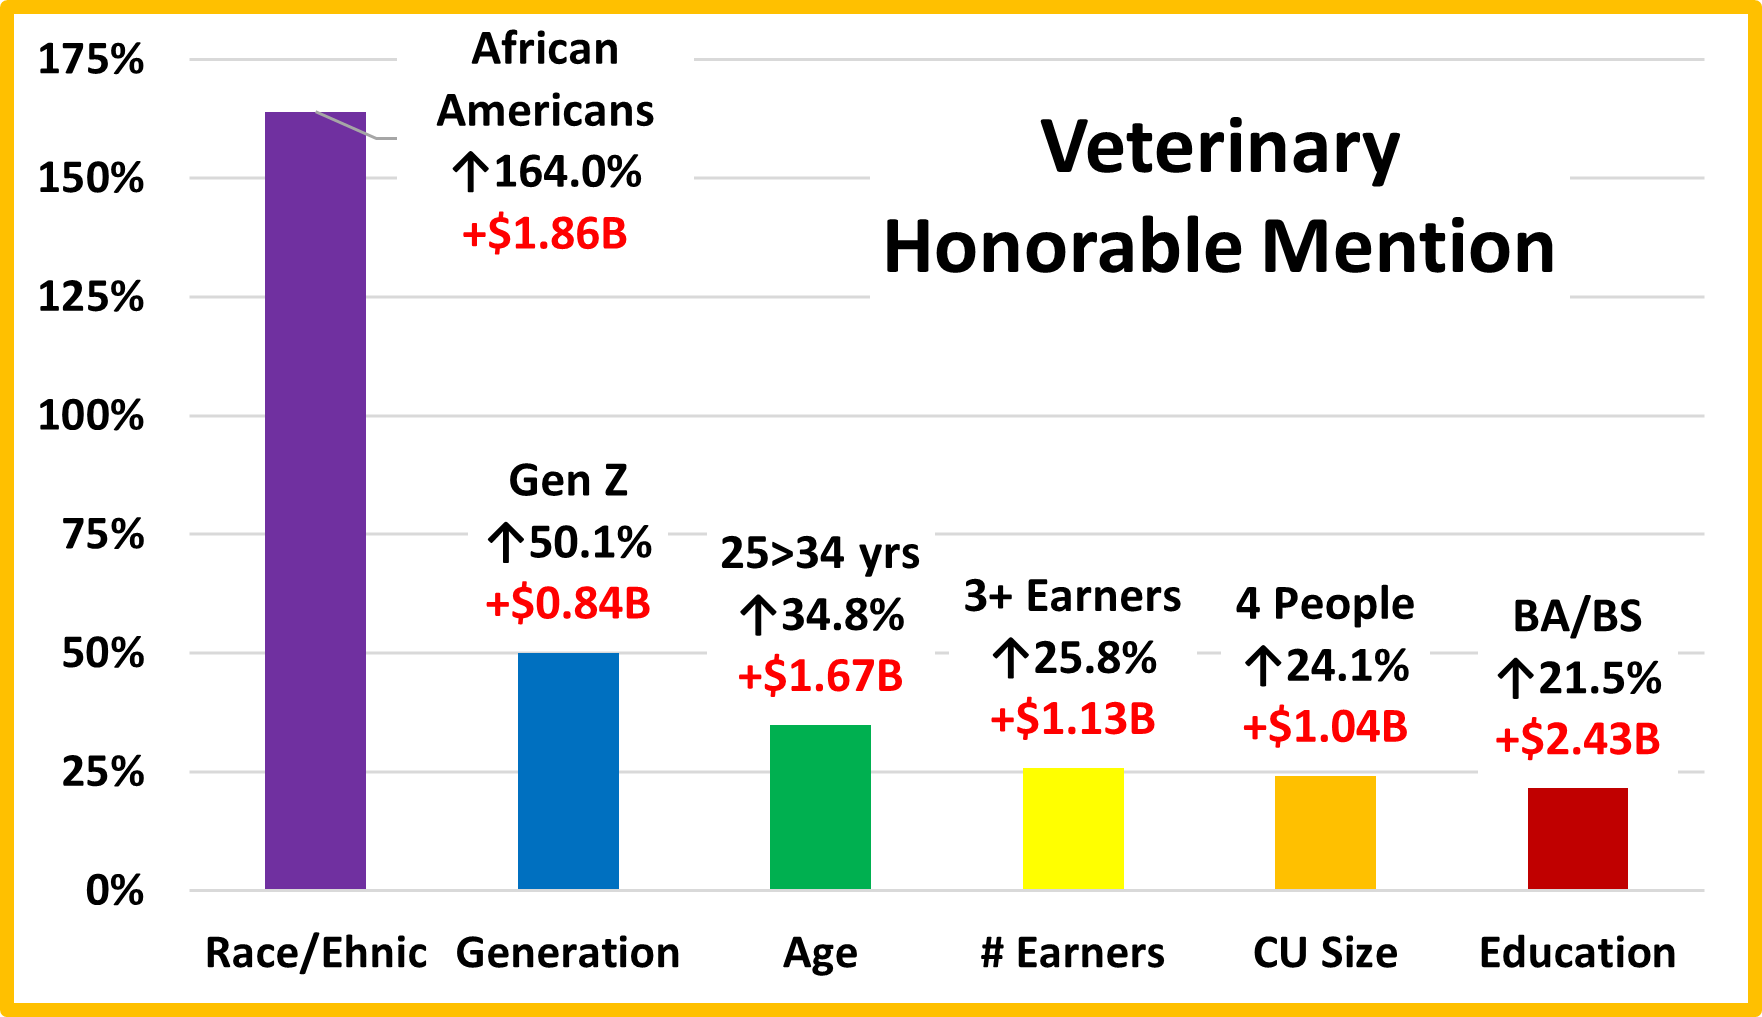
The big lift by African Americans shows more racial balance & high income is not an absolute necessity. Gen Z continues to increase their commitment to Pet Parenting. Veterinary Services spending is skewing a little younger as the 25>34 yr-olds and Gen Z become more aware of its importance. Income matters most but the # earners is increasing in importance. 3+ earners have high income and increased their Vet $ by $1.1B.  2 & 3 People CUs spend the most but the key is 2+. 4 people CUs still earn their share of Veterinary spending with 105% performance. Higher Education usually means higher income which helps with growing Vet prices, but it is also important in understanding the need for a Vet. This group shows that the lift was widespread.

Summary

In 2020 the pandemic focused Pet Parents on the needed segments. This drove a $3B increase in Veterinary $. Boomers & Millennials led the way, but the lift was widespread as 85% of demographic segments spent more. In 2021 the lift grew to a record $7.82B with 93% of all segments spending more including 9 categories where all segments had increases. In 2022, the “binge” was not repeated. Inflation also increased radically to 8.8% and spending fell -$2.95B (-9.0%). Only 23% of demographics spent more and in 3 categories all segments decreased spending.

In 2023 Inflation grew to 9.4% but the higher income groups stepped up. The $30>49K segments also found the $. The result was a $5.95B, +20.0% increase as Veterinary Spending reached $35.66B. In 2024, Vet Spending was +$5.60B, +15.7% and reached $41.26B, now #1 in the Pet Industry. 81.3% of demographics spent more (down from 82.3%) and in 2 categories all segments increased spending (down from 4). Even considering the 7.4% inflation, 69.8% spent more.

The performance of big spending groups is very important in all industry segments. In Veterinary we identified 7 demographic categories with high performing (120+%) large groups, 2 more than 2023. It is also 1 more than Supplies & 2 more than Pet Food, but 1 less than Services. The big groups with a high-performance level in Veterinary are:

  • Income: $100K> (174.5%) Performance increases with income but doesn’t reach 100+% until income reaches $100K
  • Education: College Grads (143.2%) Performance increases with education, but only College Grads are 100+%.n
  • CU Composition: Married Couples (132.9%) All Married CUs, but those with extra adults (no kids) perform at 100+%.
  • CU Size: 2>3 People (130.5%) They are the top 2 performers, but only 5+ (93.8%) & 1 (51.5%) are <100%.
  • # Earners: 2+ CUs, 1 or 2 Earners (127.3%) Only No Earner or 1 Earner CUs of any size perform <100%.
  • Housing: Homeowners (125.9%) Only Homeowners w/Mtge (160.6%) perform above 100%.
  • Race/Ethnic: White, Not Hispanic (120.0%). More Balanced, but Minorities still only perform between 52% and 68%.

Consumers have no control over Race/Ethnicity but can make decisions in the other categories. Income is still the most important factor. The others are important but lower in performance – 120>143%. Spending grew in 2024 and became less balanced, now with 7 big groups performing over 120% (up from 5). Another indication of this is that the average spending disparity between the best and worst performing segments grew from 89.8% to 99.4%. We should also note that the 50/50 spending dividing line increased from $124K to $141K, further emphasizing income’s importance.

Perhaps the biggest concern is high inflation. In 2021 spending grew 31.5% in the pandemic surge. Inflation was relatively high at 4.2% but 84% of the growth was real. In 2022 spending fell -9.0%. Inflation was 8.8% so the amount sold was really down -16.4%. In 2023, inflation reached a record 9.4%. Spending was +20.0% so the “real” increase was 9.7%. In 2024, inflation slowed to 7.4% but the lift also slowed to 15.7%. The “real” increase was 7.7%. If high inflation continues, it could have a major impact on Veterinary Spending. We’ll see.

Finally – The “Ultimate” Veterinary Services Spending CU consists of 3 people – a married couple with a child still at home. Their child is 18>. They are 45>54 yr-old Gen Xers. They are White, but not of Hispanic origin. Both work. At least one of them has an Adv. College Degree and is a Mgr/Professional. Their total income is $150>199K. They live in a rural area in the Northeast and are still paying off the mortgage on their home.


Retail Channel $ Update – March Monthly & April Advance

In April, YOY Commodities’ inflation rose to 4.6% from 3.4%. Growing current inflation rates or just high cumulative inflation vs 21 can both impact consumer spending and slow $ales growth.  We saw evidence of this in April. Total Retail $ were +4.6% vs 25, 1.7% below the average 92>25 lift. However, Relevant Retail was +5.0%, 7.3% above the April avg. The situation is definitely complex and there is still a long road to full recovery. We’ll continue to track the retail market with data from 2 reports provided by the Census Bureau and factor in a targeted CPI.

The Census Bureau Reports are the Monthly and the Advance Retail Sales Reports. Both are derived from sales data gathered from retailers across the U.S. and are published monthly at the same time. The Advance Report has a smaller sample size so it can be published quickly – normally, 2 weeks after month end. The Monthly Report includes data from all respondents, so it takes longer to compile the data – about 6 weeks. Although the sample size for the Advance report is smaller, the results over the years have proven it to be statistically accurate with the Monthly reports. The biggest difference is that the full sample in the Monthly report allows us to “drill” a little deeper into the retail channels.

We will begin with the March Monthly Report and then go to the April Advance Report. Our focus is comparing to last year but also 21 & 19. We’ll show both actual and the “real” change in sales as we factor inflation into the data.

Both reports include the following:

  • Total Retail, Restaurants, Auto, Gas Stations and Relevant Retail (removing Restaurants, Auto and Gas)
  • Individual Channel Data – This is more detailed in the Monthly reports, and we’ll focus on Pet Relevant Channels.

The data will be presented in detailed charts to facilitate visual comparison between groups/channels. The charts will show 11 separate measurements. To save space they will be displayed in a stacked bar format for the channel charts.

  • Current Month change – % & $ vs previous month
  • Current Month change – % & $ vs same month last year and vs 2021.
    • Current Month Real change vs last year and vs 2021 – % factoring in inflation
  • Current Ytd change – % & $ for this year vs last year, 2021 & 2019.
    • Current Ytd Real change % for this year vs last year and vs 2021 and 2019
  • Monthly & Ytd $ & CPIs for this year vs last year and vs 2021 which are targeted by channel will also be shown. (CPI Details are at the end of the report)

First, the March Monthly. All were up from February and there was only 1 actual sales drop – monthly vs 25 in Auto. We should note: Gas Stations are selling a little less product than in 2019. Also, Relevant Retail is all positive again. They’ve been all positive in 22 of the last 24 months. ($ are Not Seasonally Adjusted)

The March Monthly is $1.2B more than the Advance report. Restaurants: -$0.1B; Auto: +$0.5B; Gas Stations: -$0.8B; Relevant Retail: +$1.5B. Every group had a double digit % increase in the $ales lift vs February. A Feb>Mar increase in Total Retail  has happened in every year but 2020 since 1992. Plus, the 16.0% lift was 16.6% more than the 13.7% avg. There was 1 drop in actual sales – Monthly vs 25 for Auto. There were 7 “real” sales drops. In Dec>Feb there were none. Only 2 groups were all positive, down from 4 in Feb. Restaurants still have the biggest increases vs 21 & 19 but Relevant Retail stayed at the top of “real” performance vs 2019. However, only 53.1% of their growth is real.

Now, let’s see how some Key Pet Relevant channels did in March in the Stacked Bar Graph Format

Overall– All 11 were up from Feb. Vs Mar 25, 10 were actually and 6 “really” up. Vs Mar 21, 8 were up but only 5 were real lifts. Vs 2019, Only Dept Strs & Off/Gift/Souv were actually & really down.

  • Building Material Stores – The pandemic focus on home has produced $ growth of 35.2% since 2019. Prices for the group are +25.8% from 21 and +29.1% from 2019, which is impactful. With a Spring lift, HomCtr/Hdwe Sales vs Feb were +26.8% and +42.2% for Farm. Vs other years, HomCtr/Hdwe are actually up & really down for all but 2019 & vs Mar 21. Farm stores are actually up for all, but their Real $ were down vs 21. Bldg Mat’s 19>26 real growth was 5.1%. avg: 0.7%. HomeCtr/Hdwe: Ytd: 3.5%; Avg 19>26 Growth: 4.1%, Real: 0.4%; Farm: Ytd: +7.4%; Avg: 6.1%, Real: 1.9%.
  • Food & Drug – Both are essential. Except for the COVID food binge, they tend to have smaller changes in $. Vs Feb: Supermarkets: +9.3%; Drug: +11.2%. In terms of inflation, the Groceries rate is 6.3 times higher than Drug/Med products. Drug Stores are positive in all measurements and 67.5% of their 2019>26 growth is real. Supermarkets’ actual $ are up in all comparisons, but they are only “really” up vs 2019. Plus, only 6.6% of their 19>26 increase is real growth. Supermarkets: Ytd: +0.6%; Avg 19>26: +4.3%, Real: +0.3%; Drug Stores: Ytd: +2.5%; Avg: +4.8%, Real: +3.4%.
  • Sporting Goods Stores – They also benefited from the pandemic in that consumers turned to self-entertainment, especially sports & outdoor activities. Sales are +29.4% from Feb, but they are actually & really negative vs 21 and real vs Mar 25. Prices stopped deflating vs last year. Deflation started in April 23 and was a big change from +1.1% in 22>23 & +7.9% in 21>22. This caused 69% of their 44% lift since 2019 to be real. Ytd: 5.3%; Avg 19>26: +5.3%; Real: +3.8%
  • Gen Mdse Stores – $ vs Feb: SupCtr/Club; +13.8; $ Strs: +17.0%; Dept Strs: +25.0%. All YOY comparisons were up for $ Strs & SupCtr/Club. Dept Stores are negative for all but actual vs Mar 25 & Ytd vs 21. Their Actual sales are even -32.0% from 19 (real:-39.7%). The other channels have an average of 41.9% in real growth. SupCtr/Club: Ytd: +2.4%; Avg 19>26: 4.8%, Real: 2.2%; $/Value Strs: Ytd: +5.6%; Avg: +5.3%, Real: +2.7%; Dept. Strs: Ytd: -4.3%; Avg: -5.4%, Real: -7.0%.
  • Office, Gift & Souvenir Stores– Sales are +18.8% from Feb. They are actually up Mar/Ytd vs 21. All others are down. Their recovery started late. It was slowly restarting in Jun/Jul, but their progress had slowed. It took off in Oct, slowed in Nov, grew in Dec, then slowed in Jan>Mar. Recovery takes some time. Ytd: -1.1%; Avg Growth Rate: -0.4%, Real: -2.1%
  • Internet/Mail OrderSales are +14.2% from Feb to $127.1B, a Mar record. All YOY measurements are positive, but their YOY growth, +10.4%, is only 72.7% of their average since 2019. However, 81.6% of their 154.5% growth since 2019 is real. Ytd: +10.4%; Avg Growth: +14.3%, Real: +12.4%. As expected, they are by far the growth leader since 2019.
  • A/O Miscellaneous – Pet Stores are 22>24% of total $. In May 2020 they began recovery which reached $100B for the 1st time in 21. In 22 their $ dipped in Jan, Jul, Sep>Nov, rose Dec, fell Jan>Feb 23, grew Mar>May, fell Jun>Aug, rose Sep>Nov, fell Dec>Jan 24, grew Feb>May, fell Jun>Sep, grew Oct, fell Nov, rose Dec, fell Jan>Feb, grew Mar>May, fell Jun>Sep, rose Oct, fell Nov, rose Dec, fell Jan, rose Feb/Mar. All comparisons are positive, and they are #2 in the increase vs 2019 & vs 2021. Also, 78% of their 100% growth since 2019 is real. Ytd: +13.2%; Avg 19>26: 10.4%, Real: +8.6%

Mar had its usual lift vs Feb, but the Rel Retl lift was 14.8% above avg. All 11 small channels were up. The YOY lift vs 25 was 3% below avg for Total, but 35% above avg for Relevant Retl. 4 big groups & 10 smaller channels had lifts. Also, prices are only deflating in Auto, but cumulative inflation has an impact, as only 5 of 11 channels were really up vs Mar 21. The Recovery is slow. In Apr, the commodities CPI rose from 3.4% in Mar to 4.6%. Let’s see if it impacts Retail.

Only Gas Stations had a Mar>Apr lift. A Mar>Apr Total Retail drop has happened in 85% of the years since 1992. The -0.7% drop is 63% less than the -1.8% avg. There was only 1 YOY $ drop, the same as Mar. 4 Big Groups were up vs 25 but the Total Retail lift of 4.6% vs Mar 25 was 1.7% below their +4.7% 92>25 avg. However, the Relevant Retail 5.0% increase vs Mar 25 was 7.3% above their +4.6% avg. Inflation is still a factor. The CPI for all commodities rose to 4.6% from 3.4% in Mar and it is still +20.7% vs 21. There is some bad “real” news. In Jan/Feb, no “real” measurement was down. In Mar there were 7 & in Apr, 8. Plus, Gas Stations are still selling less Gas than in 2019. Also, again only 2 Big Groups are all positive. In Dec>Feb there were 4. Positive Note: Relevant Retail has now been all positive in 23 of the last 25 months.

Overall Inflation Reality– The Total Retail CPI rose to 4.6% and the $ lift vs 25 was 1.7% below avg. The Restaurant CPI slowed to +3.6% but their $ lift was 47.6% below avg. The Gas CPI rose from 18.9% to +29.1%. They are still in turmoil. Auto inflation is  -0.8% vs 25 but +13.7% vs 21. Sales were -1.1% vs 25. Their avg change is +4.5%. Inflation rose to 2.7% for Relevant Retail but their lift was 7.3% above avg and they are again all positive. Big Group progress is slow in 2026.

Total Retail – Since Jun 20, every month but Apr 23, Jun 24 & Feb 25 has set a monthly $ record. In 23>26, Sales got on a roller coaster. Up Oct>Dec, down Jan 24, up Feb>Mar, down Apr, up May, down Jun, up Jul>Aug, down Sep, up Oct>Dec, down Jan>Feb 25, up Mar, down Apr, up May, down Jun, up Jul>Aug, down Sep, up Oct, down Nov, up Dec, down Jan & Feb, up Mar, down Apr. Prices are 4.6% and YOY $ are +4.6%, 1.7% below avg. 42% of 19>26 growth is real. CPIs rose, but cumulative inflation may have the biggest impact on sales. Growth: 25>26: 4.1%; Avg 19>26: +6.1%, Real: +2.8%

Restaurants – They were hit hard by the pandemic and didn’t begin recovery until March 2021. However, they have had strong growth since then, exceeding $1T for the 1st time in 2023. Apr $ are up vs 25 and they have the biggest lifts vs 21 & 19. Inflation slowed to 3.6% vs last year, but it is +29.9% vs 21 and +35.5% vs 19. Their 3.0% YOY lift is 47.6% below their +5.6% 92>25 avg. In Mar/Apr they stopped being all positive and in Apr just 32.5% of their 63.4% growth since 2019 is real. They stayed 4th in performance. Recovery started late but inflation started early. Growth: 3.5%; Avg 19>26: +7.3%, Real: +2.7%. They just account for 13.6% of Total Retail $, but their strong growth has helped Total Retail.

Auto (Motor Vehicle/Parts Dealers) – They overcame the stay-at-home attitude with deals & advertising. They finished 2020 up 1% vs 2019 and hit a record $1.48T in 2021 but much was due to high prices. In 22, sales got on a rollercoaster. Inflation started to drop mid-year, but it caused 4 down months in $. Their YE real 22 sales numbers were even worse, -8.2% vs 21 and -8.9% vs 19. 23 started a sales rollercoaster but the $ hit a record, $1.595T. $ fell in Jan 24, grew Feb & Mar, fell Apr, grew May, fell June, grew Jul>Aug, fell Sep, grew Oct, fell Nov, grew Dec, fell Jan>Feb 25, grew Mar, fell Apr>Jun, rose Jul>Aug, fell Sep, rose Oct, fell Nov, rose Dec, fell Jan, rose Feb, fell Mar/Apr. Apr $ were -1.1% vs 25. Avg: 4.5%. Like Mar, Apr is not all positive and just 35% of 19>26 growth is real. Growth: 0.03%; Avg 19>26: +5.1%, Real:+2.0%

Gas Stations – Gas Stations were hit hard by “stay at home”. They started recovery in Mar 21, and inflation began. Sales got on a rollercoaster in 22 but set a record, $583B. Inflation started to slow in Aug and prices slightly deflated in Dec & Feb 23, then strongly fell in Mar>Jul to -20.2%. In Sep they were +2.7% but began deflating to -4.2% in Feb 24. In Mar>May $ grew, fell Jun, rose July, fell Aug/Sep, rose Oct, fell Nov>Feb 25, rose Mar>May, fell Jun, rose Jul, fell Aug>Oct, up Nov, fell Dec/Jan, rose Feb>Apr. Apr $ vs 25: +21.2% (4.4% avg). No $ downs. All real $, but Ytd vs 25 & 21 are down. Growth: +9.3%; Avg 19>26:+4.3%, Real: -0.3%. They show the impact of inflation can be “really” negative.

Relevant Retail – Less Auto, Gas and Restaurants– They account for ≈60% of Total Retail $ in a variety of channels. Their only down month until Feb 25 was Apr 20, and they led the way in Retail’s recovery. Sales got on a roller coaster in 22, but all months set new records with Dec reaching a new all-time high, $481B, and an annual record of $4.81T. In 23, the roller coaster continued. A Dec lift set a new monthly record of $494.7B & an annual record of $4.997T. The roller coaster restarted in 24. The ride continued as $ rose Oct>Jan 25, fell Feb, rose Mar>May, fell Jun, rose Jul, fell Aug & Sep, rose Oct>Dec, fell Jan>Feb 26, rose Mar, fell Apr. The Apr 5% YOY lift is 7.3% above their 92>25 avg of +4.7%. They are all positive again and 53% of their 54.5% 19>26 growth is real, again #1 in performance. Growth: 5.0%; Avg 19>26: +6.4%, Real: +3.7%. In 2024 their inflation rate fell from 3.2% to 0.1%. It rose in 25 to 1.8% in Sep, slowed to 1.5% in Oct>Nov, rose to 2.0% in Dec>Jan, 2.3% in Mar & 2.7% in Apr. YOY Inflation is low, but its cumulative impact can slow growth.

As expected, Apr sales fell vs Mar. Total Retl was -0.7%, 63% below avg; Relevant Retl was -0.7%, 35% below avg. In Apr, 1 actual YOY $ comparison was negative, the same as Mar but 1 less than Dec>Feb. There were 0 real drops in Dec>Feb. In Mar, there were 7. Apr had 8. In Dec, all were up vs last year but only Rel. Retl’s lift was above avg. In Jan, 3 lifts, all below avg. In Feb, 4 lifts, all below avg. In Mar/Apr, 4 lifts, 2 above avg. In Dec>Feb, 4 big groups were all positive. In Mar/Apr, there were only 2. Relevant Retail has now been all positive in 23 of 25 months.  YOY inflation is growing, but still relatively low. However, cumulative & impending lifts can also affect sales. Progress is slow.

Here’s a more detailed look at April by Key Channels in the Stacked Bar Graph Format

Relevant Retail: Ytd Growth: +5.0%; Avg 19>26: +6.4%; Real: 3.7%. % Real Growth: 52.7%. Only 2 were up from Mar. Vs Apr 25: 9 were up, 6 Real. Vs Apr 21: 8 were up; 6 Real. Vs 19: Dept Stores were down & “real” Furniture Stores.

  • All Department Stores – This group was struggling before the pandemic hit them hard. They began recovery in March 21. Sales are +0.4% from Mar, but all YOY measurements, actual and real are negative. Their -0.8% Apr YOY drop is much better than their -4.4% avg. Ytd Growth: -3.3%; Avg 19>26: -5.2%; Real: -6.8%. % Real growth: None
  • Club/SuprCtr/$- They fueled a big part of the recovery because they focus on value which has broad consumer appeal. $ales are -2.5% from Mar, but they are up in all comparisons but real vs Apr 25. Their 2.3% YOY Apr lift is -71% below their 92>25 avg of +8.2%. Ytd Growth: 2.7%; Avg 19>26: +4.8%; Real: 2.1%. % Real Growth: 40.9%
  • Grocery- They depend on frequent purchases, so their changes are usually less radical. $ales are -0.5% from Mar. They are actually up for all but really down for all but vs 2019. Cumulative inflation has hit them hard. Their +1.0% YOY Apr lift is 69% below their +3.1% avg. Ytd Growth: 0.7%; Avg 19>26: +4.3%; Real: 0.2%. % Real Growth: 5.0%
  • Health/Drug Stores – Many stores are essential, but consumers visit less frequently than Grocery stores. $ are -2.9% from Mar, but positive in all YOY comparisons. Inflation has been relatively low, so it is surprising that their +1.8% YOY lift vs Apr 25 is 65.1% below avg. Ytd Growth: 2.2%; Avg 19>26: +4.5%; Real: 3.1%. % Real Growth: 67.4%
  • Clothing and Accessories – Clothes mattered less if you stayed home. That changed in March 2021 with strong growth through 2022. Sales are -3.7% from Mar, but positive in all YOY measurements. $ales are +4.0% vs Apr 25, 32.1% more than their 3.1% avg. Ytd Growth: 6.3%; Avg 19>26: +3.5%; Real: 2.3%. % Real Growth: 61.4%.
  • Home Furnishings – In mid-2020 consumers’ focus turned to their homes and furniture became a priority. Inflation is down to 2.8% in Apr. $ are -5.8% from Mar and they are only actually up vs 2019. All real sales are down. YOY vs Apr 25, they are -3.4%, far below their 3.2% avg lift. Ytd Growth: -3.0%; Avg 19>26:+2.2%; Real: -0.2%. % Real Growth: None.
  • Electronic/Appliances – They have had many issues. $ fell in Apr>May of 2020 and didn’t reach 2019 levels until March 21. $ are -3.0% from Mar, but they are up in all comparisons. Strong deflation made real sales very high. Sales are +9.1% vs Apr 25, 4.3 times above the 2.1% avg. Ytd Growth: 6.3%; Avg 19>26: 1.1%; Real: 4.4%. % Real Growth: 100+%
  • Bldg Matl, Farm, Garden, Hdwe – They benefited from the consumers’ focus on home. In 22 the lift slowed as inflation grew to double digits. Prices rose again in Apr>Sep 25, dropped Oct/Nov, rose Dec/Jan to 5.6%, fell Feb to 4.8%, rose Mar to 6.0%, fell Apr to 5.0%. Sales are +10.2% from Mar and are only actually down vs Apr 21 & really up vs 2019. $ vs Apr 25 were +3.0%, 29% below their 4.2% Avg. Ytd Growth: 3.7%; Avg 19>26: 4.5%; Real: 0.8%. % Real Growth: 15.1%
  • Sporting Goods, Hobby and Book Stores – Consumers turned their attention to recreation and Sporting Goods stores sales took off. Book & Hobby Stores recovered more slowly. They have been on a sales roller coaster since June 24 and $ are -2.7% from Mar. All YOY comparisons, but real vs Apr 21 are positive. YOY Sales vs Apr 25 are +12.5%, 4.3 times more than their 2.9% avg. Ytd Growth: +9.2%; Avg 19>26: +4.6%; Real: 3.8%. % Real Growth: 79.2%.
  • All Miscellaneous Stores – Pet Stores have been a key part of the strong and growing recovery of this group. They finished 2020 at +0.9% but sales took off in March 21 and have continued to grow. Sales are -0.9% vs Mar, but positive in all comparisons. They are 2nd in the % increase vs 19 & vs 21. Plus, their 11.3% YOY Apr lift is 2.6 times more than their 92>25 avg of +4.3%. Ytd Growth: +11.6%; Avg 19>26: +8.1%; Real: 6.3%. % Real Growth: 72.7%.
  • NonStore Retailers – 90% of their $ comes from Internet/Mail Order/TV. The pandemic accelerated online spending. They ended 2020 +21.4%. The growth continued in 2021 as sales exceeded $100B for the 1st time and they broke the $1 Trillion barrier. $ are -1.5% from Mar, but their YOY lift of 10.8% is 7.1% above the 10.1% avg. Plus, they are positive in all comparisons. Ytd Growth: 10.3%; Avg 19>26: +13.2%; Real: 11.3%. % Real Growth: 80.2%.

Recap – Driven by Relevant Retail, the Pandemic recovery was widespread by Y/E 21. In 22 we were hit with the strongest inflation in 40 years. Inflation has slowed considerably from its Jun 22 peak, but only 2 smaller channels are now deflating. Deflation helps, but cumulative inflation can still have a negative impact – slowed YOY growth and even sales drops. As expected, $ fell from Mar for 9 small channels. 6 of the 9 drops were smaller than avg – Good! The biggest concern is still YOY drops and smaller lifts. Relevant Retail’s 5.0% lift vs Apr 25 was 7.3% above avg. 9 channels had a YOY lift vs last year, 1 less than Mar. 5 of the 9 lifts were above avg, 2 less than Mar. There are multiple factors slowing growth, but the major one is high prices from current & cumulative inflation. Feb is usually the worst retail month. April is the 3rd worst & the Mar>Apr drop is the 4th biggest. Both Total & Relevant Retail had record monthly sales for Dec>Apr 26. The Apr Yoy lift was -1.7% below avg for Total but 7.3% above for Relevant. The situation is definitely worse than Mar as 6 of 11 channels (only 4 in Mar) had a below avg lift or a drop vs 25. We’ll see what happens in May.

Here are the Mar/Apr inflation rates for the CPIs used to calculate the impact of inflation on retail groups and channels. This includes special aggregate CPIs created with the instruction and guidance of the US BLS. I also researched data from the last Economic Census to review the share of sales by product category for the various channels to help in selecting what expenditures to include in specific aggregates. Of course, none of these specially created aggregates are 100% accurate but they are much closer than the overall CPI or available aggregates. The data includes the CPI changes vs 21 to show cumulative inflation.

  • Monthly YOY CPI changes of 0.2% or more are highlighted. (Green = lower; Pink = higher)Here are some answers to some obvious questions. Note: Gasoline & Groceries are big drivers in the National CPI lift.
  1. Why is the group for Nonstore different from the Internet?
    • Non-store is not all internet. It also includes Fuel Oil Dealers, the non-motor fuel Energy Commodity.
  2. Why is there no Food at home included in Nonstore or Internet?
    • Online Grocery purchasing is becoming popular, but almost all is from companies whose major business is brick ‘n mortar. These online sales are recorded under their primary channel
  3. 5 Channels have the same CPI aggregate but represent a variety of business types.
    • They also have a wide range of product types. Rather than try to build aggregates of a multitude of small expenditure categories, it seemed better to eliminate the biggest, influential groups that they don’t sell. This method is not perfect, but it is certainly closer than any existing aggregate.
  4. Why are Grocery and Supermarkets only tied to the Grocery CPI?
    • According to the Economic Census, 76% of their sales comes from Grocery products. Grocery Products are the driver. The balance of their sales comes from a collection of a multitude of categories.
  5. What about Drug/Health Stores only being tied to Medical Commodities.
    • An answer similar to the one for Grocery/Supermarkets. However, in this case Medical Commodities account for over 80% of these stores’ total sales.
  6. Why do SuperCtrs/Clubs and $ Stores have the same CPI?
    • While the Big Stores sell much more fresh groceries, Groceries account for ¼ of $ Store sales. Both Channels generally offer most of the same product categories, but the actual product mix is different.

Petflation 2026 – April Update: Pet Prices Still at or Near Record Highs

It’s time to continue with 2026 Inflation. The Consumer Price Index peaked back in June 2022 at 9.1% then began to slow until it turned up in Jul/Aug 2023. Prices fell in Oct>Dec 23, then turned up Jan>Oct 24 but fell in Nov. However, they rose 10 straight months to a record high in Sep 25, fell Oct>Dec, rose in Jan>Apr (Record). The CPI vs last year rose to 3.8% from 3.3%. Grocery prices increased 0.7% from Mar and their YOY inflation grew to 2.9% from 1.9%. BTW, Gas prices are up 38.7% from Feb. Even minor price changes can affect consumer pet spending, especially in the discretionary pet segments, so we will continue to publish monthly reports to track petflation as it evolves in the market.

Petflation was +4.1% in Dec 21 while the overall CPI was +7.0%. The gap narrowed as Petflation accelerated. It was 96.7% of the national rate in June 22. National inflation has slowed considerably, but Petflation generally increased until June 23. It passed the CPI in July 22, fell below it from Apr>Jul 24. It passed the CPI in Aug, fell below in Sep>Oct, rose above in Nov, fell below in Dec>Aug 25, passed it in Sep>Oct & Dec>Mar 26, now it’s equal in Apr. All reports will include:

  • A rolling 24 month tracking of the CPI for all pet segments and the national CPI. The base number will be pre-pandemic December 2019 in this and future reports, which will facilitate comparisons.
  • Monthly comparisons of 26 vs 25 which will include Pet Segments and relevant Human spending categories. Plus
    1. CPI change from the previous month.
    2. Inflation changes for recent years (25>26, 24>25, 23>24, 22>23, 21>22, 20>21, 19>20, 18>19)
    3. Total Inflation for the current month in 2026 vs 2019 and vs 2021 to see the full inflation surge.
    4. Average annual Year Over Year inflation rate from 2019 to 2026
  • YTD comparisons
    1. YTD numbers for the monthly comparisons #2>4 above

In our first graph we will track the monthly change in prices for the 24 months from Apr 24 to Apr 26. We will use December 2019 as a base number so we can track the progress from pre-pandemic times through an eventual recovery. This chart is designed to give you a visual image of the flow of pricing. You can see the similarities and differences in segment patterns and compare them to the overall U.S. CPI. The year-end numbers & those from 12 and 24 months earlier are included. We also included and highlighted (pink) the cumulative price peak for each segment. In Apr, Total Pet prices were down -0.1% from Mar. The Service segments were up 0.01%, while Products fell -0.2%.

In Mar 24, the CPI was +22.0% and Pet was +23.7%. The Services segments inflatedDec after mid-20, while Product inflation stayed low until late 21. In 22, Food prices grew but the others had mixed patterns until July 22, when all rose. In Aug>Oct Petflation took off. In Nov>Dec, Services & Food inflated while Vet & Supplies prices stabilized. In Jan>Apr 23, prices grew every month for all segments except for 1 Supplies dip. In May Products prices grew while Services slowed. In Jun/Jul this reversed. In Aug all but Services fell. In Sep/Oct this flipped. In Nov, all but Food & Vet fell. In Dec, Supp. & Vet  drove prices up. In Jan>Mar 24 Pet prices grew. In April, prices in all but Vet fell. In May, all but Food grew. In June, Products drove a lift. In July, all but Services fell. In Aug, Food drove a drop. In Sep, Products fueled a drop. In Nov all were up. Prices dropped in Mar & Oct>Nov 25, rose Dec>Mar 26, fell Apr. All segments set records in Mar and/or Apr 26.

  • U.S. CPI – Inflation was below 2% through 2020. It turned up in January 21 and grew until flattening out in Jul>Dec 22. Prices rose Jan>Sep 23, fell Oct>Dec, rose Jan>Oct 24, fell Nov, rose Dec>Sep 25, fell Nov>, but hit record highs in Jan>Apr 26. 23% of the lift since Dec 19 happened from Jan>Jun 22 – 8% of the time.
  • Pet Food – Prices were at the Dec 19 level Apr 20> Sep /21. They grew & peaked May 23, then got on a roller which continues Jun/Jul 25, Aug, Sep↔, Oct/Nov , Dec>Mar, Apr. Over 90% of the lift was in 22/23.
  • Pet Supplies – Supplies prices were high in Dec 19 due to tariffs. They had a deflated roller coaster ride until mid-21 when they returned to Dec 19 prices & stayed there until 22. They turned up in Jan (record). They plateaued Feb>May, grew in June, flattened in July, then turned up in Aug>Oct to a new record. Prices stabilized Nov>Dec, grew Jan>Feb 23. fell in Mar, but the roller coaster hasn’t stopped. Jan>Feb 25, Mar>May, Jun, Jul, Aug, Sep, Oct>Nov, Dec(record), Jan 26, Feb>Mar(record), Apr. Prices are only 0.3% below the Mar record
  • Pet Services– Inflation is usually 2+%. Perhaps due to closures, prices increased at a lower rate in 2020. In 2021 consumer demand increased but with fewer outlets. Inflation grew in 21 with the biggest lift in Jan>Apr. Inflation was strong in 22 but prices got on a roller coaster. They turned up Jul>Apr 23, fell May. Jun>Aug, Sep>Dec, Jan>Mar 24, Apr, May, Jun, Jul>Nov, Dec>Mar 25, Apr>Aug, Sep, Oct>Apr 26(record).
  • Veterinary – Inflation has been consistent. Prices turned up in Mar 20 and grew through 21. A surge began in Dec 21 which put them above the overall CPI. In May/Jun 22 prices fell below the CPI. However, they rose again & have been above the CPI since July 22. In 23>25 prices grew Jan>May, leveled Jun/Jul, fell Aug, grew Sep>Dec, fell Jan, grew Feb>May, fell Jun>Jul, grew Aug 24>Sep 25, fell Oct>Nov, grew Dec>Apr 26. (records)
  • Total Pet – Petflation is a sum of the segments. In Dec 21 the price surge began. In Mar>Jun 22 the segments had ups & downs, but Petflation grew Jul>Nov, slowed Dec, grew Jan>May 23, fell Jun>Aug, grew Sep/Oct, then fell in Nov. Prices grew Dec>Mar 24 to a record high. Prices fell in April, rose May>Jun, fell Jul>Sep, rose Oct>Nov, fell Dec, rose Jan>Feb 25, fell Mar, grew Apr>Jul, fell Aug, rose Sep, fell Oct>Nov, rose Dec>Mar (record), then fell in Apr.

Next, we’ll turn our attention to the Year Over Year inflation rate change for April and compare it to last month, last year and to previous years. We will also show total inflation from 21>26 & 19>26. Petflation rose from 2.5% to 3.5% in Sep, fell to 2.6% in Nov, rose to 3.5% in Dec & 4.3% in Mar. In Apr it is down to 3.8%, equal to the National CPI. The chart will allow you to compare the inflation rates of 25>26 to 24>25 and other years but also see how much of the total inflation since 2019 came from the current surge. We’ve included some human categories to put the pet numbers into perspective.

Overall, prices were up 0.9% from Mar and were +3.8% vs Apr 25, up from 3.3% last month. Grocery prices rose 0.7% and inflation grew to +2.9% from 1.9%. There were 5 price drops from last month, up from 2 in Mar. In Feb, there were no drops. In Dec & Jan there was 1. In Nov there were 6 drops. The national YOY monthly CPI rate of 3.8% is up 65.2% from 24>25 but it’s 54% less than 21>22. The 25>26 rate is above 24>25 for all but Pet Supplies & Haircuts. In our 2021>2025 measurement you also can see that over 80% of the cumulative inflation since 2019 has occurred in all but 5 segments, Haircuts, Medical, Vet, Pet Services, Groceries. Service Segments have generally had higher inflation rates so there was a smaller pricing lift in the recent strong increase. Pet Products have a very different pattern. The 21>26 inflation surge provided 98% of their overall inflation since 2019. This happened because Pet Products prices in 2021 were still recovering from a deflationary period. Services expenditures account for 63.6% of the National CPI so they are very influential. Their current CPI is +3.8% while the CPI for Commodities jumped up from 3.4% to 4.6%. Services are the usual inflation driver, but Commodities are behind the current increase. The situation in Pet is closer to the “normal” national situation. Petflation: 3.8%. The CPI for the 2 Service Segments is 5.2%. The Pet Products CPI is 2.6%.

  • U.S. CPI– Prices are +0.9% from Feb. The YOY increase is 3.8%, up from 3.3% in Mar. It peaked at +9.1% back in June 2022. The targeted inflation rate is <2% so we are now 90+% higher than the target. The Mar/Apr lifts follow Feb stability, a lift in Jan, stability in Dec and 2 drops in Oct & Nov. The current rate is 65.2% above 24>25 and the 21>26 rate is +24.7%, 81.5% of the total inflation since 2019. The Inflation surge was growing in April 2021, +4.2%
  • Pet Food– Prices are -0.2% vs Mar, but +2.2% vs Apr 25, down from 2.3%. They are now 24% below the Food at Home inflation rate of +2.9%. Remember that the YOY Pet Food CPI has deflated in 15 of the last 26 months. The 2021>2026 inflation surge has generated 94.6% of the 25.9% inflation since 2019. Inflation began for Pet Food in June 2021, +0.9%, after 12 straight deflationary months. Pet Food prices are still within 0.2% of the Mar record high.
  • Food at Home – Prices are +0.7% from Mar and the YOY CPI rose from 1.9% to 2.9%. This is still radically lower than Jul>Sep 2022 when it exceeded 13%. The 32.7% Inflation for this category since 2019 is 8% more than the national CPI but is only in 5th place behind 3 Services expenditures and Total Pet. 79.2% of the inflation since 2019 occurred from 2021>26. This is slightly less than the CPI, but we should note that Grocery prices began inflating in 2020>21 then the rate accelerated. It appears that the pandemic supply chain issues in Food which contributed to higher prices started early and foreshadowed problems in other categories and the overall CPI tsunami.
  • Pets & Supplies– Prices were -0.3% from Mar and YOY inflation slowed to 1.9% from 3.5%. They still have the lowest rate vs 2019. Prices were deflated for much of 20>21. As a result, the 2021>26 inflation surge accounted for 107.5% of the total price increase since 2019. Prices set a record in Oct 22 then deflated. 3 lifts pushed them to a record high in Feb 23. Prices fell in Mar & the roller coaster continued into 25. They fell Jan/Feb 25, rose Mar>May, fell Jun, rose Jul, fell Aug, rose Sep, fell Oct>Nov, rose Dec (record), fell in Jan, rose Feb>Mar – a new record, then fell in Apr.
  • Veterinary Services– Prices are +0.2% from Mar and +5.5% from 2025, down from 5.6%. They are #2 in inflation vs last year, behind Pet Serv. but still #1 in the increase since 2019, +55.4% and 21, +43.9%. For Veterinary, high annual inflation is the norm. However, the rate has increased during the current surge, especially since 23. They have the highest Apr avg rate in 26, but only 79% of the cumulative inflation since 2019 occurred from 2021>26.
  • Medical Services – Prices turned sharply up at the start of the pandemic but then inflation slowed and fell to a low rate in 20>21. Prices fell -0.1% from Mar and inflation vs last year slowed to +3.2% from +3.7%. Medical Services are not a big part of the current surge as only 59.5% of the 22.7%, 2019>26 increase happened from 21>26.
  • Pet Services – Inflation slowed in 20 but grew in 21. In 24 prices surged in Jul>Nov, then fell to 3.9% in Dec>Mar 25. Apr grew, May fell, June rose, Jul rose to 6.3%. Inflation fell to 5.8% in Aug & to 4.2% in Nov. In Dec>Mar 26 it rose to 7.8%, then fell to 6.6% in Apr. They are #1 vs 25 and #2 vs 21 & 19. 79.8% of their 19>25 inflation is from 21>26.
  • Haircuts/Other Personal Services – Prices are -0.7% from Mar but +3.6% from Apr 25. 20 of the last 28 months have been 4.0+%. Inflation has been pretty consistent. 67.3% of the 19>26 inflation happened 21>26.
  • Total Pet– Petflation slowed to 3.8% from 4.3%. Only Veterinary & Pet Services had a higher rate. It is double the 24>25 rate but equal to the current U.S. CPI. Plus, it is 22.6% above the 3.1% average Apr rate since 1997. Apr prices fell -0.1%, driven by Products. The Mar>Apr decrease was very different from the 0.4% 97>25 average change and unexpected. Since 1997, there have been only 3 Mar>Apr price drops. A big factor in the current CPI drop was that prices rose 0.4% in Mar>Apr 25. The recovery is definitely slow. Now, we’ll look at YTD data.

The 25>26 rate is higher than 24>25 for all, but Veterinary. The 22>23 inflation rate was the highest for Tot Pet, Pet Food, Veterinary & Pet Services. 21>22 has the highest rate for Groceries, Pet Supplies & the Natl CPI. 20>21: Haircuts; 19>20: Medical Services. The average national inflation rate in the 7 years since 2019 is 3.8%. Only 3 of the categories are below that rate – Medical Services (3.0%), Pet Supplies (1.9%) and Pet Food (3.4%). It is no surprise that Veterinary Services has the highest average rate (6.5%), but all 4 other categories are +4.0% or higher.

  • U.S. CPI – The 25>26 rate is 3.0%, up 15% from 24>25 but down 9% from 23>24. It is also 62.5% less than 21>22 and 21% below the average increase from 2019>2026. However, it’s still 52% more than the average increase from 2018>21. 83% of the 29.7% inflation since 2019 occurred from 2021>26. Inflation is a problem that started recently.
  • Pet Food – Ytd prices are still inflating, 1.8%, up from 1.7%. That’s a big increase from -0.5% in 24>25, but it is still below 2.2% in 23>24 and even the 1.9% 18>20 average. Pet Food has the highest 22>23 rate but is only #6 in the 21>26 rates and #8 in 19>26. Deflation in the 1st half of 2021 kept YTD prices low then they surged in 22 and especially in 23. 93% of the inflation since 2019 occurred from 2021>26.
  • Food at Home – The 25>26 inflation rate is 9.5% above 24>25, but it is down 75% from 22>23 and 21>22. It’s even 21% less than 20>21. However, it is 70.4% higher than the average rate from 2018>20. It is only in 5th place for the highest inflation since 2019 but still beat the U.S. CPI by 7.1%. You can see the impact of supply chain issues on the Grocery category as 82% of the inflation since 2019 occurred from 2021>26.
  • Pets & Pet Supplies – A roller coaster, prices rose Jan>Feb 24, fell Mar>Apr, rose May>Jun, fell July, rose Aug, fell Sep>Oct, rose Nov>Dec, fell Jan>Feb 25, then rose Mar>May. Prices vs 24 deflated in June, back to +0.7% in July, fell to 0.0% in Aug, rose Sep>Dec, fell Jan 26, rose Feb>Mar, fell Apr. Supplies still have the lowest inflation since 2019. Their biggest YOY lifts since 2019 were in 22 & 23. The 2021 deflation created an unusual situation. Prices are up 14.0% from 2019 but 111% of this lift happened from 21>25. Prices are up 15.6% from their 2021 “bottom”.
  • Veterinary Services – Inflation was high in 2019 and steadily grew until it took off in late 2022. The rate may have peaked in 2023, but it is still going strong in 2026, +5.9%, the 2nd  highest on the chart. However, they are still #1 in inflation since 2019 and since 2021. At +6.5%, they have the highest average inflation rate since 2019. It is 71% higher than the National Average but 2.2 times higher than the Inflation average for Medical Services. Strong Inflation is the norm in Veterinary Services.
  • Medical Services – Prices went up significantly at the beginning of the pandemic, but inflation slowed in 2021. In Apr 2026 it is 3.7%, 23% above the 3.0% 2019>26 average rate. We should also note that 3.7% is 2.3 times higher than the 1.6% low point in 23>24.
  • Pet Services – After falling in late 2023, prices surged in 2024, then fell in 2025 until an Apr>Aug lift followed by a Sep>Nov dip and a Dec>Apr 26 lift. The 25>26 6.8% CPI is #1 on the chart, passing Veterinary. It is 33% above their 19>26 avg and more than double their 2018>20 avg. Pet Services is also 2nd in both 19>26 and 21>26 inflation.
  • Haircuts & Personal Services – The services segments, essential & non-essential, were hit hardest by the pandemic. The industry responded by raising prices. 2026 inflation is 4.5%, 22.4% below its 20/21 peak, but 40.6% above the 18>20 average. Consumers are paying over 35% more than in 2019, which usually reduces the purchase frequency.
  • Total Pet – Petflation is 3.7%, up 95% from 24>25, but 64.1% less than their 22>23 peak. However, It’s 61% more than their 18>21 avg and 23% above the CPI. Petflation is still growing. Except for Mar/Aug/Oct/Nov, Pet prices rose in 25, which continued in Jan>Mar 26, then paused in Apr. The overall gain is primarily being driven by a flip from deflation to inflation in Pet Products and continued strong inflation in Services, especially Non-Vet.

The Petflation recovery paused in Aug 24, came back Sep>Oct, paused in Nov, resumed in Dec>Jan 25, paused in Feb, restarted in Mar and paused Apr>Sep. It improved Oct/Nov but paused in Dec>Apr 26. We tend to focus on the monthly, YOY inflation in the current year and ignore the fact that inflation is cumulative. Pet prices are 28.2% above 2021 and 33.3% higher than 2019. Those are big lifts. In fact, Mar prices for the National CPI, Total Pet and all pet segments reached new record highs. In Apr, prices either set a new record or are within 0.3% of Mar. Only Supplies prices (+14.7%) are less than 25.9% higher than 2019. Since price/value is the biggest driver in consumer spending, inflation will affect the Pet Industry. Services will be the least impacted as it is the most driven by high income CUs. Veterinary will continue to see a reduction in visit frequency. Pet Parents will just pay more. The product segments will see a more complex reaction. Supplies are more discretionary so we will likely see a reduction in purchase frequency. In Pet Food, the most needed segment, some Pet Parents may choose to downgrade their Pet Food. However, the biggest impact in both product segments will be a strong movement to online purchasing and private label. We saw proof of this at both GPE 25 & SZ 25 as a huge # of exhibitors offer OEM services. At GPE 26, this trend continued. Strong, cumulative inflation has a widespread impact. We’ll continue to monitor the situation.

2024 Pet Services Spending was $13.65B – Where did it come from…?

Next, Pet Services. It is by far the smallest Segment, but like Supplies & Veterinary, it had a record increase in 2021. However, unlike them, there was no $ drop in 2022. The lift grew stronger, up $3.26 (+35.8%). After the great recession, Services’ annual spending slowly but steadily increased. During this time, the number of Services outlets grew as brick ‘n mortar retailers looked for a way to combat the growing influence of online outlets. After all, you can buy products, but you can’t get your dog groomed on the Internet. This created a highly price competitive market for Pet Services. In 2017 there was a slight increase in visit frequency, but Pet Parents just paid less. This resulted in a 1.0% decrease in Services spending. In 2018 consumer behavior changed as a significant number decided to take advantage of the increased availability and convenience of Pet Services and spending literally took off, +$1.95B (+28.9%), the biggest increase in history. In 2019 Pet Parents, especially the younger ones, value shopped, and spending turned down $0.10B. In the 2020 pandemic Services outlets were often deemed nonessential and were subject to restrictions and closures which drove a huge drop in $. In 2021 things opened up and Services spending rebounded with 2 consecutive record lifts in 2021 & 2022. In 2023, the growth continued but it slowed, +$1.05B (+8.5%). It slowed even more in 2024, +$0.23B, +1.7%.

Services spending is the most discretionary, but its reach is expanding. Let’s look deeper into the demographics.

Let’s start by identifying the groups most responsible for the bulk of Services spending in 2024 and the $0.23B increase. The first chart details the biggest Pet Services spenders for each of 10 demographic categories. It shows their share of CU’s, share of Services spending and their spending performance (Share of spending/share of CU’s). In order to better target the bulk of the spending we altered 2 groups – income & housing. In 2023 4 were changed. The performance level should also be noted as 8 of 10 groups have a performance level above 120%. This is 1 more than 2023, but 2 more than Supplies, 3 more than Pet Food and even 1 more than Veterinary and Total Pet. The increase from 2023 indicates that Pet Services spending was likely less balanced in 2024. It again has the biggest disparity between the best and worst performing segments. Income is still the biggest factor in Services Spending. The categories are presented in the order that reflects their share of Total Pet $ which highlights the differences of the 8 matching groups. The biggest share ranking differences from Total Pet is that Education has a bigger share in Services.

  1. Housing – Homeowners w/Mtge (62.8%) up from 61.3%. Homeownership is a big factor in spending in all industry segments. This special group was created because those w/Mtge reached the 60% target in 2023. Their performance grew from 162.6% to 170.2% and they stayed #2 in importance. Homeowners without a mortgage  (-$0.10B) and Renters (-$0.01B) spent less.
  2. Race/Ethnic – White, not Hispanic (80.7%) down from 84.2%. This group accounts for most of the spending in all segments. Their performance fell from 126.9% to 122.1% and they dropped from 5th to 8th place in importance. Only Whites spent less. African Americans, +$0.27B & Hispanics, +$0.20B led the way.
  3. Area – Urban Areas (80.8%) up from 79.2% in share, and performance grew from 97.8% to 100.0%. They finally earned their share of $pending. Services is an Urban Segment. They are the only Pet segment with 100% performance. Only the Suburbs spent more, +$1.48B, but Center City was only -$0.05B.
  4. Income – $100K> (71.3%) up from 70.7% This group’s performance rating is 187.9%, down from 194.1%. Income is still by far the most important factor in increased Pet Services Spending. Only the $70>99K and $150>199K income groups spent more. At +$0.82B, $150K>199K had the biggest increase. The biggest decrease was -$0.34B by the $100>149K group. The performance decrease was due to a 2.5M increase in $100K> CUs while <$100K fell 1.3M.
  5. # in CU – 2>4 people (74.3%) up from 71.3% Their performance also increased from 119.2% to 123.4% and CU Size moved up to #6 from #8 in importance. Only 2 & 4 people CUs spent more. The biggest drop was -$0.37B by 3 people CUs. 4 People CUs were +$0.69B, which drove the share/performance lifts and put them in the 120% club.
  6. Occupation– All Wage & Salary (69.3%) up from 66.2% and their performance rating rose from 108.7% to 112.2%. They stayed #9 in importance. Only Mgrs/Prof and Retirees spent more. Managers & Professionals had the biggest $ increase, +$1.04B, +18.1%. The biggest drop was Self-employed, -$0.36B, -26.3%. These 2 spending patterns were critical in the lifts in share/performance. The Mgrs/Prof lift pushed the Total Wage & Salary Group up to +$0.58B while the Self-employed drop drove the other segments total down to -$0.35B. Hence…the changes
  7. Education – College Grads (76.9%) up from 72.7%. Income generally increases with education so Services spending grows with increasing education. Performance grew from 152.0% to 159.9% but Education stayed #3 in importance. Only HS Grads (only) & College Grads spent more. College: +$0.75B; <College: -$0.52B.
  8. CU Composition – Married Couples (69.1%) up from 67.8%. Married couples are a big share of $ and have 100+% performance in all segments. Their performance increased to 144.0% from 140.7% but they stayed #4 in importance in Services spending. Only Singles, Married, Child <6 and Married, Plus Adults spent less. All Married were +$0.33B, while Unmarried were -$0.10. This caused the changes.
  9. # Earners – 2+ CUs, 1 or 2 Earners (65.4%) up from (61.1%) All adults in the CU don’t necessarily work. Income is important but is slightly below avg for the 1 Earner segment. Their performance rose to 130.5% from 121.7% and # of Earners moved up from #7 to #4 in importance. Only the segments in this big group & No Earner, Singles spent more. The big group was +$0.72B which caused the share/performance lifts.
  10. Age – 35>64 (66.7%) up from 64.8%. Their performance grew from 124.0% to 128.8%. Age stayed #6 in importance. Only 25>34, 45>54 & 75> spent more. The 45>54 group was +$0.83B, +30.1%. This big lift made up for the -$0.43B drop by other members of this big group and drove the lift in share & performance.

We changed 2 of the groups for Services – Income & Housing to better target the biggest spenders. We should also note that Income is still more important to spending in Services than in any other segment. In the Big Groups, only Race/Ethnic fell in both share and performance. Also, Services now has 8 groups performing at 120+%, up from 7 in 2023 and 6 in 2022. Overall, in 2024 Services spending became less demographically balanced.

Now, we’ll look at 2024’s best and worst performing Pet Services spending segments in each category.

The best & worst performers are not surprising. There are 3 that are different from 2023, 2 Best & 1 Worst, 1 less than last year. CU Comp & Size reinforce the move towards “family” CUs. Income is a big factor for almost all categories. Gen X is still on top, but spending shifted away from 55>64, their oldest members, to 45>54. The average difference between Best & Worst is 119.5%, the highest of any segment and up from 111.8% in 2023. Pet Services spending became a little less balanced in 2024. Changes from 2023  are “boxed”. We should note:

  • Income is most important in Services. 276.2%, down from 314.7%, but still the highest by any group in any segment.
  • # Earners – 2 Earners stayed on top and No Earner, Singles stayed on the bottom.
  • Age – 45>54 is all Gen X. They have the highest income. 35>64 have the 3 highest incomes & performed at 100+%.
  • Area – Suburbs replaced Rural on top and Center City performance is now up to 95.4%.
  • Region – In 2023, 3 were 100+%. In 2024, only 2 – West & Midwest. Northeast replaced South on the bottom.
  • CU Composition – Married, Oldest child 6>17, are again on top while Single Parents remain firmly at the bottom.
  • CU Size – The key is having 2+ people in the CU. Only 4 & 2 People perform above 100%. However, 3 & 5+ People are close. Both are 94.1% or higher. 1 Person CUs Services’ performance is 55.0%.
  • Generation – Gen X retained the Top Spot and Gen Z stayed at the bottom. Millennials earned their share with 100+% performance, but not Boomers, 80.5%. Born <1946 was next to last with 57.2%.

In Pet Services spending performance, income is still the major factor. Spending began skewing younger in 2018. They slipped a little in 2019, but basically held their ground during the pandemic. In 2021, Boomers, Millennials and younger Gen Xers got on board. In 2022 & 2023, spending skewed towards older Gen Xers. In 2024, it was the Gen X core, 45>54.

It’s time to “Show you the money”. Here are segments with the biggest $ changes in Pet Services Spending.

In this chart you immediately see the difference from last year. In 2024 you see a little less stability. There were 4 repeats. In 2023 there were 7. Also, 3 segments flipped from 1st to last or vice versa. In 2023 there were 2 flips. 2021 & 2022 had record increases, but the lift in 2023 was only $1.05B, and fell to +$0.23B, +1.7% in 2024. Plus, there were no categories where all segments spent more. compared to 2 in 2023. Also, 48% of 96 demographic segments spent more, down from 75% in 2023. Another thing is definitely worse. The biggest drop was -$0.90B. In 2023, it was only -$0.58B.

Here are the specifics:

  • Occupation – Both winner and loser are new.
    • Winner–– Mgrs & Professionals – Pet Services Spending: $6.79B; Up $1.04B (+18.1%)                 2023: Retired
    • Loser – Self-employed – Pet Services Spending: $1.00B; Down $0.36B (-26.3%)                             2023: Tech/Sls/Clerical
    • Comment – Retirees also spent a little more, +$0.03B. All others spent less.
  • Region – The 2023 Winner & Loser both flipped.
    • Winner – South – Pet Services Spending: $4.77B; Up $0.89B (+23.0%)                                       2023: Northeast
    • Loser – Northeast – Pet Services Spending: $1.88B; Down $0.64B (-25.4%)                              2023: South
    • Comment – In 2021 & 2022, all spent more. In 2023 only the South spent less. In 2024, the West also spent less.
  • Age – Both winner and loser are new. No surprises.
    • Winner – 45>54 yrs – Pet Services Spending: $3.57B; Up $0.83B (+30.1%)                               2023: 55>64 yrs
    • Loser – 65>74 yrs – Pet Services Spending: $1.62B; Down $0.48B (-22.9%)                             2023: 25>34 yrs
    • Comment: In 2022 only the <25 group spent less. In 2023, 25>34 & 65>74 had drops. In 2024, only 25>34, 45>54 & 75> spent more. 45>54 took the lead but 35>64 is still pretty balanced between the 3 groups. They have the 3 highest incomes and account for 51.8% of CUs, but 66.7% of Pet Services spending.
  • Income – $150>199K won, no surprise. However, $100>149K was an unexpected loser.
    • Winner – $150>199K – Pet Services Spending: $2.55B; Up $0.82B (+47.2%)                               2023: $200K>
    • Loser – $100>149K – Pet Services Spending: $2.59B; Down $0.34B (-11.8%)                             2023: $70 to $99K
    • Comment – Only $70>99K & $150>199K spent more, but their lifts totaled +$1.32B, which more than made up for the -$1.09B drop by other segments. Note: In the big income groups, only $70K> & $100K> spent more.
  • # in CU – Both the Winner & Loser are new and don’t usually lead in change.
    • Winner – 4 People – Pet Services Spending: $2.69B; Up $0.69B (+34.3%)                                    2023: 5+ People
    • Loser – 3 People – Pet Services Spending: $1.91B; Down $0.37B (-16.1%)                                   2023: 1 Person
    • Comment: 2 People also spent +$0.26B more. The 2 & 4 People lifts pushed 2+ CUs up to +$0.46B.
  • Education – Both the Winner & Loser are again new. These 2 are not surprising.
    • Winner – Advanced Degree – Pet Services Spending: $5.95B; Up $0.67B (+12.6%)                              2023: BA/BS Degree
    • Loser – HS Grad w/some College – Services Spending: $1.15B; Down $0.55B (-32.2%)                      2023: Assoc. Degree 
    • Comment – All College Grads plus those who are only HS Grads are the only segments that spent more. Amazingly, HS Grads only had a +30.2% lift. College Grads were +0.75B; <College were -$0.52B.
  • # Earners– 2 Earners held their spot at the top while 1 Earner, Singles replaced No Earner, Singles at the bottom.
    • Winner – 2 Earners – Pet Services Spending: $6.81B; Up $0.66B (+10.7%)                                      2023: 2 Earners
    • Loser – 1 Earner, Single – Pet Services Spending: $1.64B; Down $0.24B (-12.9%)                         2023: No Earner, Single
    • Comment – Only 2 Earners, 1 Earner, 2+ CUs & No Earner, Singles spent more, but 2 of 3 were +$0.06B or less.
  • Area Type – Rural stayed on the bottom while Center City replaced the Suburbs at the top.
    • Winner – Center City – Pet Services Spending: $4.57B; Up $0.56B (+13.9%)                                2023: Suburbs 2500>
    • Loser – Rural – Pet Services Spending: $2.62B; Down $0.17B (-6.1%)                                           2023: Rural
    • Comment – In 2023, all segments spent more. In 2024 only Center City had a lift.
  • Generation – Gen X stayed on top and Boomers replaced Born <1946 at the bottom.
    • Winner – Gen X – Services: $5.29B; Up $0.51B (+10.7%)                                                   2023: Gen X
    • Loser – Boomers – Services: $3.36B; Down $0.90B (-21.1%)                                            2023: Born <1946
    • Comment – In 2022, all generations spent more. In 2023, only Born <1946 spent less. In 2024, only Boomers spent less. Millennials again finished in second place with a strong $0.47B, +13.0% increase.
  • Housing – Homeowners w/Mtge stayed on top, while those w/o Mtge replaced Renters on the bottom.
    • Winner – Homeowner w/Mtge – Services: $8.57B; Up $0.34B (+4.1%)                                  2023: Homeowner w/Mtge
    • Loser – Homeowner w/o Mtge – Services: $3.00B; Down $0.10B (-3.2%)                             2023: Renter
    • Comment – Only Homeowners w/Mtges spent more. The drop by Renters was only -$0.01B, -0.4%.
  • Race/Ethnic – White, Not Hispanic flipped to the bottom while African Americans replaced them on top.
    • Winner – African Americans – Services: $0.88B; Up $0.27B (+43.8%)                                    2023: White, Not Hispanic
    • Loser – White, Not Hispanic – Services: $11.02B; Down $0.27B (-2.4%)                                2023: Hispanic
    • Comment– Only Whites spent less. All minorities spent more, totaling +$0.51B, +23.9%.
  • CU Composition – Both Winner & Loser are new and not surprising.
    • Winner – Married, Child 18> – Services: $1.59B; Up $0.18B (+12.6%)                                       2023: Married, Couple Only
    • Loser – Singles – Services: $2.26B; Down $0.23B (-9.2%)                                                             2023: Unmarried, 2+ Adults
    • Comment – Only Singles, Married Child <6 & Married, +Adults, No Kids spent less. The increases were all $0.18B or less and the decreases, other than Singles, were -$0.11B or less.

We’ve seen the winners and losers in terms of change in Services Spending $ for 12 Demographic Categories. The growth slowed in 23 after 2 record lifts but was still widespread. In 24, the lift slowed even more and was far less widespread. Here’s some data which shows the evolution from 2019 to 2024. Services were hit hard by the pandemic but recovered stronger than ever with 2 record lifts. In 2024 the situation has become similar to pre-pandemic 2019 but with $5.03B more spending, a 41.6% increase. The avg 19>24 annual lift was +7.2%.

Total $:                2019: $8.62B     2020: $6.89B       2021: $9.10B       2022: $12.36B      2023: $13.42B      2024: $13.65B

% Segmts $:     2019: 49%           2020: 21%          2021: 90%            2022: 93%             2023: 75%             2024: 47%

Avg Big $:         2019: $0.25B      2020: $0.05B      2021: $1.10B        2022: $1.43B        2023: $0.73B        2024: $0.62B

Avg Big $:         2019: -$0.27B    2020: -$0.89B     2021: $0.07B        2022: $0.16B        2023: -$0.16B       2024: -$0.39B 

We found the winners in performance and $, but there were others who performed well but didn’t win. They deserve…

Honorable Mention

Services is the most driven by high income. The performance of the lower-income segments in this group gives evidence that Service usage is still widespread. $70>99K was up 40% while HS Grads increased their spending by 30.1%. The 75+, 27% lift shows that Pet Parenting is a lifetime commitment. Whites spent less, but all Minorities spent more. The 2 lowest income groups had the biggest lifts – African Americans, +$0.27B; Hispanics, +$0.20B. Millennials aren’t low income or low profile. They are just preparing for their time at the top in Pet Spending. The Midwest has a slightly below avg income, but their Pet Services spending performance is 109.6%. Service prices are high, but they are a great benefit, so many are finding the $.

Summary

For years, Services’ spending slowly but steadily increased. However, the number of outlets offering Services was radically increasing. In 2017, this competitive pressure caused Pet Parents to shop for value and spending fell 1%. In 2018, the abundance of outlets and competitive prices finally had their intended impact. Many more consumers took advantage of the convenience of Pet Services and spending literally took off with a record increase. In 2019 Consumers held their ground, but we saw turmoil similar to 2017. Again, value shopping likely contributed to the small decrease.

In 2020, pandemic Services outlets were often deemed nonessential, so they were subject to restrictions and closures. Services are definitely needed by some groups. However, for most demographics, Services are a convenience, and spending is very discretionary in nature. The reduced availability and the pandemic driven focus on the “needed” segments – Food and Veterinary caused a 20% drop in Services $.

In 2021 the Retail Marketplace opened up again and many Pet Parents strongly returned to their previous Services mantra, “I need help with my Pet “children” and I have the money to pay for it!”. This behavior was widespread as 90% of all demographics spent more on Services, producing a record increase. In 2022 Services showed that it was different from other segments. All had record lifts related to the Pandemic followed by drops, except for Services. 2022 spending didn’t decrease, it grew even stronger, +$3.26B and more widespread as 93% of demographics increased spending. In 2023, growth continued, but slowed considerably, +$1.05B. It slowed even more in 2024, +$0.23B, +1.7%. The lifts were also becoming less widespread as 75% of CUs spent more in 2023. This fell to 48% in 2024. There was another definite negative. Services is the segment where spending is the most driven by income, so it has always had a big disparity between segments. This worsened in 2023 & 2024. Performance differences are a key measurement of disparity. Let’s consider the performance of the big groups. In 2024, there were 8 categories with a 120+% performing big group, up 1 from 2023 and the most of any segment. Services has 1 more than Veterinary (7), 2 more than Supplies (6) and 3 more than Food (5). There is an even better measure of the worsening. In 2024, the average difference between best & worst performers was 119.5%. In 2023 it was 111.8% and only 100.3% in 2022. Another key trend in 2024 was that 35>64 is still the dominant group, but spending is now skewing towards the midrange 45>54 yr olds. They have the highest income, so this makes sense.

Services were hit the hardest by the pandemic, but they had a record, widespread recovery in 2021>22. They are the segment most driven by high income so the high inflation in 2022>24 had less of an impact. It did affect the spending of some financially challenged groups, but in 2024, Services spending seems to have returned to a pattern similar to 2019.

At Last – The “Ultimate” Pet Services Spending Consumer Unit consists of 4 people – a married couple with children 6>17. They are 45>54 yr-old Gen Xers and White, but not of Hispanic origin. They both work and at least one of them has an Advanced College Degree and is a Manager or Professional. They have an income of over $200K. They live in a suburb with a population over 2500 in the Western U.S. and are still paying off their home mortgage.

Retail Channel $ Update – February Monthly & March Advance

In March, YOY Commodities’ inflation jumped up to 3.4% from 1.2%. Even when inflation rates are low, high cumulative inflation vs 21 can still impact consumer spending and slow $ales growth.  We saw evidence of this in March. Total Retail $ were +4.5% vs 25, 6.4% below the average 92>25 lift. However, Relevant Retail was +6.0%, 27% above the March avg. The situation is definitely complex and there is still a long road to full recovery. We’ll continue to track the retail market with data from 2 reports provided by the Census Bureau and factor in a targeted CPI.

The Census Bureau Reports are the Monthly and the Advance Retail Sales Reports. Both are derived from sales data gathered from retailers across the U.S. and are published monthly at the same time. The Advance Report has a smaller sample size so it can be published quickly – normally, 2 weeks after month end. The Monthly Report includes data from all respondents, so it takes longer to compile the data – about 6 weeks. Although the sample size for the Advance report is smaller, the results over the years have proven it to be statistically accurate with the Monthly reports. The biggest difference is that the full sample in the Monthly report allows us to “drill” a little deeper into the retail channels.

We will begin with the February Monthly Report and then go to the March Advance Report. Our focus is comparing to last year but also 21 & 19. We’ll show both actual and the “real” change in sales as we factor inflation into the data.

Both reports include the following:

  • Total Retail, Restaurants, Auto, Gas Stations and Relevant Retail (removing Restaurants, Auto and Gas)
  • Individual Channel Data – This is more detailed in the Monthly reports, and we’ll focus on Pet Relevant Channels.

The data will be presented in detailed charts to facilitate visual comparison between groups/channels. The charts will show 11 separate measurements. To save space they will be displayed in a stacked bar format for the channel charts.

  • Current Month change – % & $ vs previous month
  • Current Month change – % & $ vs same month last year and vs 2021.
    • Current Month Real change vs last year and vs 2021 – % factoring in inflation
  • Current Ytd change – % & $ for this year vs last year, 2021 & 2019.
    • Current Ytd Real change % for this year vs last year and vs 2021 and 2019
  • Monthly & Ytd $ & CPIs for this year vs last year and vs 2021 which are targeted by channel will also be shown. (CPI Details are at the end of the report)

First, the February Monthly. All but Auto were down from January but there were only 2 actual sales drops – monthly/ytd vs 25 in Gas Stations. We should note: Gas Stations are still selling a little more product than in 2019. Also, Relevant Retail is all positive again. They’ve been all positive in 21 of the last 23 months. ($ are Not Seasonally Adjusted)

The February Monthly is $1.6B more than the Advance report. Restaurants: +$0.3B; Auto: -$0.2B; Gas Stations: +$0.1B; Relevant Retail: +$1.4B. Relevant Retail was the driver in the $ales drop vs January and only Auto was up. A Jan>Feb decrease in Total Retail  has happened in 65% of the years since 1992. However, the 2.9% drop was 4 times more than the 0.7% avg. There were 2 drops in actual sales – Monthly/Ytd vs 25 for Gas Stations. There were no “real” sales drops, the same as Dec/Jan. All but Gas Stations were all positive. Restaurants still have the biggest increases vs 21 & 19 but Relevant Retail stayed at the top of “real” performance vs 2019. However, only 53.2% of their growth is real.

Now, let’s see how some Key Pet Relevant channels did in February in the Stacked Bar Graph Format

Overall– 8 of 11 were down from Jan. Vs Feb 25, 8 were actually and 6 “really” up. Vs Feb 21, 11 were up but only 6 were real lifts. Vs 2019, Only Dept Strs & Off/Gift/Souv were actually & really down.

  • Building Material Stores – The pandemic focus on home has produced $ growth of 31.9% since 2019. Prices for the group have inflated 26.0% from 21 and 28.3% from 2019, which is having an impact. HomeCtr/Hdwe Sales vs Jan were -3.8% but +1.2% for Farm Stores. Vs other years, HomCtr/Hdwe are actually up & really down for all but 2019. Farm stores are actually up for all, but their Real $ were down vs 21. Bldg/Mat group’s 19>26 real growth was 2.8%. avg: 0.4%. HomeCtr/Hdwe: Ytd: 2.4%; Avg 19>26 Growth: 3.7%, Real: 0.1%; Farm: Ytd: +7.7%; Avg: 5.8%, Real: 2.1%
  • Food & Drug – Both are essential. Except for the COVID food binge, they tend to have smaller changes in $. Vs Jan: Supermarkets: -11.0%; Drug: -5.1%. In terms of inflation, the Groceries rate is 24 times higher than Drug/Med products. Drug Stores are positive in all measurements and 64.3% of their 2019>26 growth is real. Supermarkets’ actual $ are up in all comparisons, but vs Feb 25. They are only “really” up vs 2019 and only 8.7% of their 19>26 increase is real growth. Supermarkets: Ytd: +0.7%; Avg 19>26: +4.5%, Real: +0.4%; Drug Stores: Ytd: +1.5%; Avg: +4.4%, Real: +3.0%.
  • Sporting Goods Stores – They also benefited from the pandemic in that consumers turned to self-entertainment, especially sports & outdoor activities. Sales are -1.5% from Jan, but their only negative is real Ytd vs 21. Prices stopped deflating vs last year. Deflation started in April 23 and was a big change from +1.1% in 22>23 & +7.9% in 21>22. This caused 70% of their 44% lift since 2019 to be real. Ytd: 5.4%; Avg 19>26: +5.4%; Real: +3.9%
  • Gen Mdse Stores – Sales were -6.1% vs Jan. All YOY comparisons but 1 were up for $ Strs & SupCtr/Club (real vs 25) Dept Stores are negative in all comparisons but actual Feb/Ytd vs 21. Their Actual sales are even -33.3% from 19 (Real: -40.6%). The other channels have an average of 43.9% in real growth. SupCtr/Club: Ytd: +2.3%; Avg 19>26: 5.0%, Real: 2.4%; $/Value Strs: Ytd: +4.5%; Avg: +5.4%, Real: +2.7%; Dept. Strs: Ytd: -7.8%; Avg: -5.6%, Real: -7.2%.
  • Office, Gift & Souvenir Stores– Sales fell -4.3% from Jan. They are actually up Feb/Ytd vs 21. All others are down. Their recovery started late. It was slowly restarting in Jun/Jul, but their progress had slowed. It took off in Oct, slowed in Nov, grew in Dec, then slowed in Jan/Feb. Recovery takes some time. Ytd: -1.5%; Avg Growth Rate: -0.8%, Real: -2.4%
  • Internet/Mail Order – Sales are -5.1% from Jan to $110.2B, a Feb record. All YOY measurements are positive, but their YOY growth, +8.2%, is only 59.0% of their average since 2019. However, 81.6% of their 148.1% growth since 2019 is real. Ytd: +8.2%; Avg Growth: +13.9%, Real: +12.0%. As expected, they are by far the growth leader since 2019.
  • A/O Miscellaneous – Pet Stores are 22>24% of total $. In May 2020 they began their recovery which reached $100B for the 1st time in 21. In 22 their $ dipped in Jan, Jul, Sep>Nov, rose Dec, fell Jan>Feb 23, grew Mar>May, fell Jun>Aug, rose Sep>Nov, fell Dec>Jan 24, grew Feb>May, fell Jun>Sep, grew Oct, fell Nov, rose Dec, fell Jan>Feb, grew Mar>May, fell Jun>Sep, rose Oct, fell Nov, rose Dec, fell Jan, rose Feb. All comparisons are positive, and they are #2 in the increase vs 2019 but #1 vs 2021. Also, 78% of their 101% growth since 2019 is real. Ytd: +14.6%; Avg 19>26: 10.5%, Real: +8.7%

Feb had its usual drop vs Jan, but the Rel Retl drop was only half of the avg. 8 of 11 small channels were down. The YOY lift vs 25 was below avg for Total: -16% & Relevant Retl: -10%, but 4 big groups & 8 smaller channels had lifts. Also, prices are only deflating in Auto & Gas Stations, but cumulative inflation has an impact, as only 6 channels were really up vs Feb 21. The Recovery is slow. In Mar, the commodities CPI rose from 1.2% in Feb to 3.4%. Let’s see if it impacts Retail

Feb>Mar sales were up for all. A Feb>Mar Total Retail lift has happened in every year but 2020 since 1992. The 16% lift is 16.6% more than the 13.7% avg. There was only 1 YOY $ drop, 1 less than Feb. 4 Big Groups were up vs 25 but the Total Retail lift of 4.5% vs Mar 25 was 6.4% below their +4.8% 92>25 avg. However, the Relevant Retail 6.0% increase vs Mar 25 was 27% above their +4.7% avg. Inflation is still a factor. The CPI for all commodities rose to 3.4% from 1.2% vs last month and it is now +20.7% vs 21. There is some bad “real” news. In Jan/Feb, no “real” measurement was down. In Mar, there were 8. Plus, Gas Stations are again selling less Gas than in 2019. Also, only 2 Big Groups are all positive. In Dec>Feb there were 4. Positive Note: Relevant Retail has now been all positive in 22 of the last 24 months.

Overall Inflation Reality– The Total Retail CPI rose to 3.4% and the $ lift vs 25 was 6.4% below avg. The Restaurant CPI slowed to +3.7% but their $ lift was 72.5% below avg. The Gas CPI rose from -5.6% to +18.9%. They are still in turmoil. Auto inflation is  -0.9% vs 25 but +17.9% vs 21. Sales were -2.3% vs 25. Their avg change is +4.6%. Inflation rose to 2.3% for Relevant Retail but their lift was 27% above avg and they are again all positive. Big Group progress is slow in 2026.

Total Retail – Since Jun 20, every month but Apr 23, Jun 24 & Feb 25 has set a monthly $ales record. In 2023>26, Sales got on a roller coaster. Up Oct>Dec, down Jan 24, up Feb>Mar, down April, up May, down Jun, up Jul>Aug, down Sep, up Oct>Dec, down Jan>Feb 25, up Mar, down Apr, up May, down Jun, up Jul>Aug, down Sep, up Oct, down Nov, up Dec, down Jan>Feb, up Mar. Prices are 3.4% and YOY $ are +4.5%, 6.4% below avg. 42% of 19>26 growth is real. CPIs rose, but cumulative inflation may have the biggest impact on sales. Growth: 25>26: 3.8%; Avg 19>26: +6.0%, Real: +2.8%

Restaurants – They were hit hard by the pandemic and didn’t begin recovery until March 2021. However, they have had strong growth since then, exceeding $1T for the 1st time in 2023. Mar $ are up vs 25 and they have the biggest lifts vs 21 & 19. Inflation slowed to 3.7% vs last year, but it is +30.0% vs 21 and +35.0% vs 19. Their 1.6% YOY lift is 72.5% below their +5.7% 92>25 avg. They are no longer all positive and just 33% of their 63% growth since 2019 is real. They stayed 4th in performance. Recovery started late but inflation started early. Growth: 3.8%; Avg 19>26: +7.3%, Real: +2.7%. They just account for 13.8% of Total Retail $, but their strong growth has helped Total Retail.

Auto (Motor Vehicle/Parts Dealers) – They overcame the stay-at-home attitude with deals & advertising. They finished 2020 up 1% vs 2019 and hit a record $1.48T in 2021 but much was due to high prices. In 22, sales got on a rollercoaster. Inflation started to drop mid-year, but it caused 4 down months in $. Their YE real 22 sales numbers were even worse, -8.2% vs 21 and -8.9% vs 19. 23 started a sales rollercoaster but the $ hit a record, $1.595T. $ fell in Jan 24, grew Feb>Mar, fell Apr, grew May, fell June, grew Jul>Aug, fell Sep, grew Oct, fell Nov, grew Dec, fell Jan>Feb 25, grew Mar, fell Apr>Jun, rose Jul>Aug, fell Sep, rose Oct, fell Nov, rose Dec, fell Jan, rose Feb, fell Mar. Mar $ were -2.3% vs 25. Avg: 4.3%. They are no longer all positive and just 34% of 19>26 growth is real. Growth: 0.3%; Avg 19>26: +5.0%, Real: +1.9%

Gas Stations – Gas Stations were hit hard by “stay at home”. They started recovery in Mar 21, and inflation began. Sales got on a rollercoaster in 22 but set a record, $583B. Inflation started to slow in Aug and prices slightly deflated in Dec & Feb 23, then strongly fell in Mar>Jul to -20.2%. In Sep they were +2.7% but began deflating to -4.2% in Feb 24. In Mar>May $ grew, fell Jun, rose July, fell Aug/Sep, rose Oct, fell Nov>Feb 25, rose Mar>May, fell Jun, rose Jul, fell Aug>Oct, up Nov, fell Dec/Jan, rose Feb/Mar. Mar $ vs 25: +18.3% (4.4% avg). No $ downs but all real $, including vs 19 are down. Growth: +5.6%; Avg 19>26:+4.1%, Real: -0.9%. They show the impact of inflation can be “really” negative.

Relevant Retail – Less Auto, Gas and Restaurants– They account for ≈60% of Total Retail $ in a variety of channels. Their only down month until Feb 25 was Apr 20, and they led the way in Retail’s recovery. Sales got on a roller coaster in 22, but all months set new records with Dec reaching a new all-time high, $481B, and an annual record of $4.81T. In 23, the roller coaster continued. A Dec lift set a new monthly record of $494.7B & an annual record of $4.997T. $ales got back on the roller coaster in 24. The ride continued as $ rose Oct>Jan 25, fell Feb, rose Mar>May, fell Jun, rose Jul, fell Aug>Sep, rose Oct>Dec, fell Jan>Feb 26, rose Mar. The Mar 6% YOY lift is 27% above their 92>25 avg of +4.7%. They are all positive again and 53% of their 54% 19>26 growth is real, again #1 in Big Group performance. Growth: 4.8%; Avg 19>26: +6.4%, Real: +3.7%. In 2024 their inflation rate fell from 3.2% to 0.1%. It rose in 25 to 1.8% in Sep, slowed to 1.5% in Oct>Nov, rose to 2.0% in Dec>Jan & 2.3% in Mar. YOY Inflation is low, but its cumulative impact can slow growth.

As expected, Mar sales rose vs Feb. Total Retl was +16.0%, +16.6% above avg; Relevant Retl was +14.1%, +13.6% above avg. In Mar, 1 actual YOY $ comparison was negative, 1 less than Dec>Feb. There were 0 real drops in Dec>Feb. In Mar, there were 9. In Dec, all were up vs last year but only Rel. Retl’s lift was above avg. In Jan, 3 lifts, all below avg. In Feb, 4 lifts, all below avg. In Mar, 4 lifts. Rel Retl & Gas Stat. were above avg. In Dec>Feb, 4 big groups were all positive. In Mar, there were only 2. Relevant Retail has now been all positive in 22 of 24 months.  YOY inflation is growing, but still relatively low. However, cumulative & impending lifts can also affect sales. There are mixed results, so progress is slow.

Here’s a more detailed look at March by Key Channels in the Stacked Bar Graph Format

  • Relevant Retail: Ytd Growth: +4.8%; Avg 19>26: +6.4%; Real: 3.7%. % Real Growth: 52.9%. All 11 were up from Feb. Vs Mar 25: 10 were up, 7 Real. Vs Mar 21: 6 were up; 6 Real. Vs 19: Dept Stores were down & “real” Furniture Stores.
  • All Department Stores – This group was struggling before the pandemic hit them hard. They began recovery in March 21. Sales are +25.1% from Feb, but all YOY measurements but actual vs Mar 25 & Ytd vs 21 are negative. Their 1.3% Mar YOY lift is much better than their -4.4% avg. Ytd Growth: -4.3%; Avg 19>26: -5.4%; Real:-7.0%. % Real growth: None
  • Club/SuprCtr/$- They fueled a big part of the recovery because they focus on value which has broad consumer appeal. $ales are +14.0% from Feb, and they are up in all comparisons. Their 3.1% YOY Mar lift is -64% below their 92>25 avg of +8.4%. Ytd Growth: 2.7%; Avg 19>26: +5.0%; Real: 2.4%. % Real Growth: 41.8%
  • Grocery- They depend on frequent purchases, so their changes are usually less radical. $ales are +9.5% from Feb. They are actually up for all but really down for all but vs 2019. Cumulative inflation has hit them hard. Their +0.3% YOY Mar lift is 89% below their +3.2% avg. Ytd Growth: 0.5%; Avg 19>26: +4.3%; Real: 0.2%. % Real Growth: 5.0%
  • Health/Drug Stores – Many stores are essential, but consumers visit less frequently than Grocery stores. $ are +10.6% from Feb and they are positive in all YOY comparisons. Inflation has been relatively low, so it is surprising that their +3.0% YOY lift vs Mar 25 is 42.7% below avg. Ytd Growth: 2.0%; Avg 19>26: +4.4%; Real: 3.0%. % Real Growth: 65.4%
  • Clothing and Accessories – Clothes mattered less if you stayed home. That changed in March 2021 with strong growth through 2022. Sales are +18.9% from Feb and positive in all YOY measurements. $ales are +7.0% vs Mar 25, more than double their 3.4% avg. Ytd Growth: 7.1%; Avg 19>26: +3.5%; Real: 2.3%. % Real Growth: 64.0%.
  • Home Furnishings – In mid-2020 consumers’ focus turned to their homes and furniture became a priority. Inflation is 4.3% in Mar. $ are +15.2% from Feb but they are only actually up vs 2019. All real sales are down. YOY vs Mar 25, they are -0.4%, far below their 3.3% avg lift. Ytd Growth: -2.8%; Avg 19>26:+2.3%; Real: -0.2%. % Real Growth: None.
  • Electronic/Appliances – They have had many issues. $ fell in Apr>May of 2020 and didn’t reach 2019 levels until March 21. $ are +9.4% from Feb and they are up in all but vs Mar 21. Strong deflation made real sales very high. Sales are +6.1% vs Mar 25, 2.8 times above the 2.2% avg. Ytd Growth: 5.3%; Avg 19>26: 0.8%; Real: 4.0%. % Real Growth: 100+%
  • Bldg Matl, Farm & Garden & Hdwe – They truly benefited from the consumers’ focus on home. In 2022 the lift slowed as inflation grew to double digits. Prices turned up again in Apr>Sep 25, dropped Oct/Nov, rose Dec/Jan to 5.6%, fell Feb to 4.8%, rose Mar to 6.0%. Sales are +27.8% from Feb and are only actually down vs Mar 21 & really up vs 2019. Sales vs Mar 25 were +5.3%, 27% above their 4.1% Avg. Ytd Growth: 4.0%; Avg 19>26: 4.4%; Real: 0.7%. % Real Growth: 14.5%
  • Sporting Goods, Hobby and Book Stores – Consumers turned their attention to recreation and Sporting Goods stores sales took off. Book & Hobby Stores recovered more slowly. They have been on a sales roller coaster since June 24 and $ are +19.3% from Feb. All YOY comparisons, but actual & real vs Mar 21 are positive. YOY Sales vs Mar 25 are +5.3%, 61.8% more than their 3.25% avg. Ytd Growth: +7.2%; Avg 19>26: +4.5%; Real: 3.7%. % Real Growth: 79.5%.
  • All Miscellaneous Stores – Pet Stores have been a key part of the strong and growing recovery of this group. They finished 2020 at +0.9% but sales took off in March 21 and have continued to grow. Sales are +12.8% vs Feb and positive in all comparisons. They are 2nd in the % increase vs 19 & vs 21. Plus, their 10.3% YOY Mar lift is 2.2 times more than their 92>25 avg of +4.7%. Ytd Growth: +12.0%; Avg 19>26: +8.1%; Real: 6.3%. % Real Growth: 73.4%.
  • NonStore Retailers – 90% of their $ comes from Internet/Mail Order/TV. The pandemic accelerated online spending. They ended 2020 +21.4%. The growth continued in 2021 as sales exceeded $100B for the 1st time and they broke the $1 Trillion barrier. $ are +13.3% from Feb and their YOY lift of 13.2% is 33.6% above the 9.9% avg. Plus, they are positive in all comparisons. Ytd Growth: 9.7%; Avg 19>26: +13.1%; Real: 11.2%. % Real Growth: 80.3%.

Recap – Driven by Relevant Retail, the Pandemic recovery was widespread by Y/E 21. In 22 we were hit with the strongest inflation in 40 years. Inflation has slowed considerably from its Jun 22 peak, but only 1 smaller channel is now deflating. Deflation helps, but cumulative inflation can still have a negative impact – slowed YOY growth and even sales drops. As expected, $ rose from Feb for all small channels. 10 of the 11 lifts were above avg – Very Good! The biggest concern is still YOY drops and smaller lifts. Relevant Retail’s 6.0% lift vs Mar 25 was 27% above avg. 10 channels had a YOY lift vs last year, 2 more than Feb. 7 of the 10 lifts were above avg, 3 more than Feb, but equal to the 7 back in Oct 25. There are multiple factors slowing growth, but the major one is high prices from cumulative inflation. Dec is the biggest retail month, and Feb is usually the worst. The Feb>Mar lift is 2nd to Nov>Dec. Total & Relevant Retail had record monthly sales for Dec>Mar. The Mar Yoy lift was -6% below avg for Total but +27% above for Relevant. The situation is definitely better than Feb as only 4 of 11 channels (7 in Feb) had a below avg lift or a drop vs 25. We’ll see what happens.

Here are the Feb/Mar inflation rates for the CPIs used to calculate the impact of inflation on retail groups and channels. This includes special aggregate CPIs created with the instruction and guidance of the US BLS. I also researched data from the last Economic Census to review the share of sales by product category for the various channels to help in selecting what expenditures to include in specific aggregates. Of course, none of these specially created aggregates are 100% accurate but they are much closer than the overall CPI or available aggregates. The data includes the CPI changes vs 21 to show cumulative inflation.

Monthly YOY CPI changes of 0.2% or more are highlighted. (Green = lower; Pink = higher)

Here are some answers to some obvious questions. Note: Inflation only slowed for Grocery, Furniture & Electronics.

  • Why is the group for Nonstore different from the Internet?
    • Non-store is not all internet. It also includes Fuel Oil Dealers, the non-motor fuel Energy Commodity.
  • Why is there no Food at home included in Nonstore or Internet?
    • Online Grocery purchasing is becoming popular, but almost all is from companies whose major business is brick ‘n mortar. These online sales are recorded under their primary channel.
  • 5 Channels have the same CPI aggregate but represent a variety of business types.
    • They also have a wide range of product types. Rather than try to build aggregates of a multitude of small expenditure categories, it seemed better to eliminate the biggest, influential groups that they don’t sell. This method is not perfect, but it is certainly closer than any existing aggregate.
  • Why are Grocery and Supermarkets only tied to the Grocery CPI?
    • According to the Economic Census, 76% of their sales comes from Grocery products. Grocery Products are the driver. The balance of their sales comes from a collection of a multitude of categories.
  • What about Drug/Health Stores only being tied to Medical Commodities.
    • An answer similar to the one for Grocery/Supermarkets. However, in this case Medical Commodities account for over 80% of these stores’ total sales.
  • Why do SuperCtrs/Clubs and $ Stores have the same CPI?
    • While the Big Stores sell much more fresh groceries, Groceries account for ¼ of $ Store sales. Both Channels generally offer most of the same product categories, but the actual product mix is different.

2024 Pet Supplies Spending was $23.91B – Where did it come from…?

Next, we’ll turn to Pets & Supplies. We’ll see differences from Pet Food as the Supplies spending is more discretionary. There are other factors too. Spending can be affected by other segments as consumers often trade $ between segments. However, the biggest factor is price. Many categories are now commoditized so price changes can impact buying. In the 2nd half of 2016, deflation began, and Supplies started a 24-month lift, totaling $5B. Prices turned up in mid-2018 due to new tariffs and Supplies $ fell a record -$3B in 2019. In the 2020 pandemic, Supplies weren’t a necessity, so sales fell, -$1.7B. In 2021, Pet Parents caught up with their children’s needs and Supplies spending exploded, +$8.65B. In 2022, the “binge” was not repeated, and inflation was 7.7%. Spending fell -$1.86B. In 2023, inflation fell to 2.6% and Supplies $ grew $1.08B, 4.9% to $23.02B. In 2024, inflation slowed to 0.9%, but Supplies $ only grew $0.89B, +3.9% to $23.91B.

Let’s see which groups were most responsible for the bulk of Pet Supplies spending in 2024 and the $0.89B lift. The first chart details the biggest pet supplies spenders for each of 10 demographic categories. It shows their share of CU’s, share of Supplies spending and their spending performance (Share of spending/share of CU’s). All groups are the same as Total Pet. The groups are presented in the order that reflects their share of Total Pet Spending. This highlights the differences in share. There is also a difference in performance. There are 6 groups with performance of 120% or more, the same as 2023, but 1 less than Total Pet and 1 more than Pet Food. The stability in the number of 120+% groups  indicates that in 2024 there was no major change in spending balance for Supplies.

  1. Race/Ethnic – White, not Hispanic (81.3%) down from 83.6%. This large group accounts for the vast majority of spending in every segment. Their share decreased. Their performance fell from 125.9% to 123.0% and they dropped from #3 to a tie for #4 in importance in spending. Minority groups account for 33.9% of all CUs and their spending rose to 18.7% of Supplies $. All minorities spent more. Hispanics were the leader, +$48B, +22.3%.
  2. # in CU – 2>4 people (69.2%) up from 67.8% and their performance grew from 113.5% to 115.0%. 1, 3 & 5 People CUs spent less while 2 & 4 people CUs were +$1.15B. This caused the lifts in share & performance.
  3. Housing – Homeowners (79.8%) up from 78.4%. Homeownership is a big factor in pet ownership and spending in all segments. Their performance rose to 123.0%, from 120.4% and they moved up to a tie for #4 in importance. Led by w/o Mtge, Homeowners spent more while Renters were -3.0%. This caused the share/performance increases.
  4. Age – 35>64 (63.6%) up from 61.9%. Their performance level rose to 122.8% from 118.8%. They joined the 120+% club and moved up from #7 to #6 in importance. The <35 group spent less. <25 had the biggest drop, -$0.52B, -49.5%. The top spending 45>54 yr olds were also -$0.12B. All others spent more. The biggest $ lift was +$0.73B by 35>44. The biggest % increase was +44.0% by 75+ yr olds. Age became noticeably more important.
  5. Area – All Urban (74.0%) up from 70.3% and their performance grew to 91.6%, from 87.2%, but Area stayed last in importance. In this category, only the big Suburbs had an increase, +$1.48B, +14.9%. Rural had the biggest drop,  -$0.54B. Center City also spent less, but it was only -$0.05B and they passed Rural in spending share. This is why the group changed. Center City has great potential, which will be realized as housing becomes more “pet friendly”.
  6. Income Over $70K (73.2%) up from 72.1%. A gain in share, but their Performance fell from 142.7% to 140.0%. Income remains the most important factor in increased Pet Supplies Spending. $70K> spent +$0.92B more, while <$70K was -$0.03B. Only <$50K (-$0.26B) and $150>199K (-$0.87B) spent less. All others spent more. The biggest increase was +$1.37B by the $200K> group. A key factor in the increase in share but drop in performance was that $70K> gained 3.1 million CUs. This gain in CU share lowered performance.
  7. # Earners – 2+ CUs, 1 or 2 Earners (59.6%) up from 56.8%. Their performance grew from 112.8% to 119.0%, but Earners fell from #4 to #7 in importance and and are out of the 120% club. The # Earners is less important. It is income that truly matters. 1 Earner CUs of any size spent less on Supplies. 3+ Earner CUs also spent less. The only increases came from No Earner & 2 Earner CUs. 2 Earners had the biggest lift, +$1.59B, +17.3%.
  8. Occupation – All Wage & Salary Earners (67.1%) down from 69.3%. Their performance was 108.6%, down from 113.8%. Only Tech/Sls/Cler (-$1.13), Service Workers & A/O Unemployed spent less. Most other groups had small lifts. The 2 biggest increases were Mgrs/Professionals, +$1.25B and Retired, +$0.94B.
  9. CU Composition – Married Couples (60.3%) down from 61.3%. Their performance also decreased from 127.2% to 125.6% and they fell from 2nd to 3rd in importance. Only Married, Couple Only, Married, + adults & Singles had decreases. The biggest lift was +$0.75B from Married, Child 18>. The Married group was +$0.33B, +2.3%, while Unmarried was +$0.57B, +6.4%. This caused the decreases in share and performance for all Married CUs.
  10. Education – College Grads (62.8%) up from 56.1%. This group was reduced because of spending changes. In 2024, they gained market share and their performance level increased from 117.4% to 130.6%. Higher Education rose from 6th to 2nd in importance. In the Education category, the only spending decreases were by <HS Grads, HS Grads w/some College & Associates’ Degrees. There were big lifts by Adv. Degrees, +$1.65B & HS Grads, +$0.71B. The summary is <College were -$1.19B, -11.8% & College Grads were +$2.09B, +16.2%. This caused the changes.

Pet Supplies spending still skews more towards younger and higher income CUs than Food. However, the biggest difference may be in the spending disparity in segments within the big groups. Supplies has 6 big groups with perfomance of at least 120%. Food is up to 5, but 4 are different from Supplies and Total Pet.

Now, we’ll look at 2024’s best and worst performing Pet Supplies spending segments in each category.

Almost all of the best and worst performers are those that we would expect. The only small surprise is 5+ CUs. In Pet Supplies spending, there are 9 that are different from 2023, up from 8 last year. That is 3 more than Veterinary & Total Pet, 6 more than Services, but 6 less than Food. They have 5 new winners. With 7, only Food has more. In terms of disparity, the difference between the avg winner & loser was 86.2%, down from 95.4% in 2023 and much less than 123.6% in 2021. A little more balanced at the segment level. Changes from 2023 are “boxed”. We should note:

  • Income matters in Supplies spending – 188.3% performance and a disparity of 148.1%.
  • Occupation – Blue Collar replaced Retired. Only White-Collar Workers – at any level, perform at 100+%.
  • Age – The youngsters, <25 replaced the oldsters, 75+ on the bottom.
  • Education – Adv College Degree & <HS Grads. Both are new, but they occupied these spots in 2022.
  • Region – The Northeast replaced the Midwest at the top, but the South was in their usual spot at the bottom. The South is the only Region with under 100% performance, but the disparity narrowed to 29% from 60% in 2023.
  • CU Composition – Married, Oldest Child 18> replaced Child 6>17 on top while Singles replaced Single Parents at the bottom. In 2024, all Married CUs, except those with an oldest child <6 or only extra adults, performed over 100%.
  • CU Size – 5+ People returned to the top, replacing 3 People. 1 Person CUs are the only size performing <100%.

Performance Overview – The decrease in the avg disparity was <10%, 86.2% from 95.4%, it was also less widespread than the lift in 2023. In 2023, 10 were up in disparity. In 2024, 8 of 12 were down in disparity. Occupation, CU Comp, Housing and Education had a bigger disparity.

Now, it’s time to “Show you the money”. Here are segments with the biggest $ changes in Pet Supplies Spending.

In 2019, Tarifflation caused a record $2.98B drop in Supplies spending. 2020 brought the pandemic and pet parents focused on “needs” so the more discretionary Supplies segment fell $1.65B. In 2021 Pet Parents caught up on the Supplies needs and spent a record $8.65B more. In 2022, the binge wasn’t repeated so the $ fell -$1.86B. In 2023 there was a $1.08B lift. In 2024, it was only $0.89B. In the chart, there are No repeats from 2023, and 12 segments flipped from last to 1st or vice versa – lots of turmoil. In 2023 there were 5 repeats and 9 flips. In 2024, 60.4% of segments spent more and Race/Ethnic was all positive. In 2023, 65.6% spent more and Housing was all positive. Here are the specifics:

  • Education – Both winner & loser flipped.
    • Winner – Adv. College Degree – Supplies: $7.24B; Up +$1.65B (+29.4%)                                              2023: HS Grad w/some College
    • Loser – HS Grad w/some College – Supplies Spending: $3.07B; Down $0.98B (-24.1%)                    2023: Adv College Degree
    • Comment – HS Grads (+$0.71B) and BA/BS (+$0.44B) also spent more. All others spent less. College Grads were +$2.09B. All without a College degree were -$1.19B. Higher Education mattered.
  • # Earners – Again, the winner & loser flipped, producing a more expected result.
    • Winner – 2 Earners – Pet Supplies Spending: $10.81B; Up +$1.59B (+17.3%)                                          2023: 1 Earner, Single
    • Loser – 1 Earner, Single – Pet Supplies Spending: $2.81B; Down -$0.55B (-16.5%)                                2023: 2 Earners
    • Comment – Income is the biggest factor, but the # of Earners is still important in Supplies Spending. The ups & downs were mixed with a complex pattern. 1 Earner CUs of any size and 3+ Earners spent less. All No Earner CUs of any size and 2 Earners spent more. Except for the winner & loser, the changes were small.
  • Area Type– Rural flipped from 1st to last and Suburbs 2500> replaced them on top.
    • Winner – Suburbs 2500> – Pet Supplies Spending: $11.40B; Up +$1.48B (+14.9%)                            2023: Rural
    • Loser – Rural – Pet Supplies Spending: $6.22B; Down -$0.54B (-7.9%)                                                    2023: Center City
    • Comment – Center City had a miniscule, -$0.05B (-0.7%) drop. This was a key factor in Urban replacing Suburban/Rural as the big group in the Area Type Category.
  • Income – $150>199K flipped to the bottom and $200K> replaced them on top.
    • Winner – $200K> – Pet Supplies Spending: $5.49B; Up +$1.37B (+33.2%)                                2023: $150>199k
    • Loser – $150>199K – Pet Supplies Spending: $3.38B; Down -$0.87B (-20.4%)                                2023: $40>49K
    • Comment – Only segments <$50K & $150>199K spent less. The big group, <$70K was also down -$0.03B. All other segments & big groups were up. Again, almost all changes were small.
  • Occupation – Tech/Sls/Clerical flipped from 1st to last, and Mgrs/Professionals replaced them at the top.
    • Winner – Mgrs/Prof. – Supplies Spending: $9.39B; Up +$1.25B (+15.4%)                                  2023: Tech/Sls/Cler.
    • Loser – Tech/Sls/Cler. – Supplies Spending: $3.24B; Down -$1.13B (-25.8%)                            2023: Blue Collar
    • Comment – Service Workers & A/O, Unemployed also spent less. Everyone else spent more. Except for +$0.94B by Retirees, the changes were small.
  • # in CU – The Winner & Loser flipped again.
    • Winner – 4 People – Pet Supplies Spending: $3.80B; Up $0.94B (+32.7%)                               2023: 3 People
    • Loser – 3 People – Pet Supplies Spending: $4.29B; Down -$0.20B (-4.5%)                                2023: 4 People
    • Comment: In 2024, 2 & 4 People CUs spent more, while 1, 3 & 5+ CUs spent less. This is the exact opposite of the situation in 2023.
  • Region – The South flipped again, this time from last to 1st. The Midwest replaced them on the bottom.
    • Winner – South – Pet Supplies Spending: $7.91B; Up $0.91B (+13.0%)                                            2023: Northeast
    • Loser – Midwest – Pet Supplies Spending: $5.49B; Down -$0.90B (-14.1%)                              2023: South
    • Comment – In 22 & 23, 2 spent more & 2 spent less. In 2024, 3 spent more, all but the Midwest. The Northeast had a smaller $ increase than the South, +$0.64B, but their % lift was bigger, +15.6%.
  • Housing – Homeowners w/o Mtge flipped to the top, while Renters replaced them on the bottom.
    • Winner – Homeowner w/o Mtge – Supplies: $6.48B; Up +$0.88B (+15.7%)                          2023: Homeowner w/Mtge
    • Loser – Renter – Supplies: $4.83B; Down -$0.15B (-3.0%)                                                            2023: Homeowner w/o Mtge
    • Comment – In 2023 all Housing segments spent more. In 2024, only Renters spent less. Except for Homeowners w/o Mtge, the changes were small, 3% or less.
  • CU Composition – Married, Oldest Child 18> flipped from last to 1st. Married, Couple Only replaced them as last.
    • Winner – Married, Oldest Child 18> – Supplies: $3.19B; Up $0.75B (+30.8%)                       2023: Singles
    • Loser – Married, Couple Only – Supplies: $5.50B; Down $0.44B (-7.4%)                                    2023: Married, Oldest Child 18>
    • Comment – All CUs with children, including Single Parents spent more, +$1.16B. CUs with no children spent
    • -$0.27B less. We should note that unmarried, 2+ all adult CUs did spend +$0.51B more.
  • Age – Both the Winner and Loser are new.
    • Winner – 35>44 yrs – Pet Supplies Spending: $5.20B; Up $0.73B (+16.3%)                                2023: 45>54 yrs
    • Loser – <25 yrs – Pet Supplies Spending: $0.53B; Down -$0.52B (-49.5%)                                    2023: 55>64 yrs
    • Comment: 2023 Supplies spending was an age rollercoaster. 2024 had ups and downs but it was simpler. <35: -$0.84B; 35>44: +$0.73B; 45>54: -$0.12B; 55>: +$1.12B.
  • Generation – Both are new. The Winner & Loser got younger.
    • Winner – Millennials – Supplies: $7.14B; Up $0.48B (+7.2%)                                  2023: Gen X
    • Loser – Gen Z – Supplies: $1.18B; Down -$0.35B (-22.7%)                                           2023: Boomers
    • Comment – Only Gen Z spent less. The performance by the oldest generations, those born <1946, should be noted. They had the 2nd biggest $ lift, +$0.40B, but it was +64.1% – a huge, significant increase.
  • Race/Ethnic – All segments are positive. Both the winner & loser are new and minorities.
    • Winner – Hispanic – Supplies: $2.62B; Up +$0.48B (+22.3%)                                2023: White, Not Hispanic
    • Loser – Asian – Supplies: $0.69B; Up +$0.2B (+2.6%)                                                2023:  African Americans
    • Comment – Whites’ share of Pet Supplies $ fell to 81.3% from the 83.3% in 2023. However, they still drive this discretionary segment. They have the highest % of pet ownership and the second highest income. The interaction of these two factors is very apparent in this category. All groups spent more and the lift by minorities was +$0.68B, 76% of the 23>24 Supplies increase. Spending became a little more racially/ethnically balanced.

We’ve now seen the winners and losers in Pet Supplies Spending $ for 12 Demographic Categories. In 2022, despite the -$1.86B decrease, 52% of demographic segments spent more but there was no all-positive category.  In 2023, there was a small lift, $1.08B, 65.6% of demographics spent more and Area Type was all positive. In 2024, there was much more turmoil than 2023, and the spending lift was even smaller, +$0.89B. 60.4% of demographics spent more, 9% less than 2023. However, again one demographic category was all positive – Race/Ethnic. In performance, there were no big surprises and the disparity between winner and loser decreased by 9%. The performance winners reflected the importance of income in Supplies spending. However, not every good performer can be “the” winner and some of these “hidden” segments should be recognized for their performance. They don’t win an award, but they deserve…

HONORABLE MENTION

Supplies spending is driven by income, but Pet Parenting is widespread. This is very apparent in the strong performance of these segments. All have below average incomes, with many at or near the bottom in their category. No Earner, Singles earn <$30K but found the $ for a 55% lift in Supplies. Pet Parenting is a lifetime commitment. Retired & 75> yr olds clearly show this. HS Grads were the only segment without a college degree to spend more on Supplies. Education matters, with some exceptions. Marriage & children are also big factors in Supplies spending, but not a necessity. Pet Parenting is widespread and Supplies improve the experience. All Adult, 2+ CUs spent $0.51B more. The $50>69K group had a double-digit lift in Supplies $. This clearly demonstrates that while income may be the most important, it is not the only factor in Supplies spending. Although the lift was small, it was demographically relatively widespread.

Summary

While Pet Food spending has shown a definite pattern, Pet Supplies have been on a roller coaster ride since 2009. Many Supplies categories have become commoditized and react strongly to changes in the CPI. Prices go up and spending goes down…and vice versa. Supplies spending has also been reactive to big spending changes in Food. Consumers spend more to upgrade their Food, so they spend less on Supplies – trading dollars. We saw this in 2015. In 2016 the situation reversed. Consumers value shopped for Food and spent some of the “saved” money on Supplies.

That brought us to 2017. Both Supplies and Food prices deflated while the inflation rate in both of the Services segments dropped to lows not seen in recent years. Value was the “word” and it was available across the market. Perhaps the biggest impact was that the upgrade to super premium Food significantly penetrated the market. This could have negatively impacted Supplies Spending, but it didn’t. Supplies’ spending increased in 93% of all demographic segments.

2018 started out as expected with a $1B increase in Supplies and a small lift in Food. Then the government got involved. In July the FDA issued a warning on grain free dog food and spending dropped over $2B. New tariffs were implemented on Supplies and spending flattened out then turned down -$0.01B in the 2nd half. The full retail impact of Tariffs hit home in 2019 when Supplies spending fell -$2.98B, affecting 97% of all demographic segments.

In 2020 The pandemic caused consumers to focus on needs. That resulted in big spending lifts for Food and Veterinary and big drops in Supplies and Services. Some good news was that Supplies spending became more balanced. The performance gap between best and worst narrowed by 10.25%.

In 2021 the overall Retail Market had recovered but with no repeat  of the buying binge, Pet Food $ dropped. In Supplies, the pent-up buying desires of Pet Parents were unleashed. They bought all the Supplies items that had been on “hold” for the last 2 years. The result was the biggest spending increase in history.  In 2022, the Supplies binge was also not repeated, and inflation took off, so spending fell -$1.86B. However, 52% segments still spent more on Supplies.

In 2023, inflation slowed and Supplies had a small $1.08B, 4.9% lift. 65.6% of segments spent more and the Housing category was all positive.  The disparity between best & worst performers grew to 95.4% from 87.5%. In 2024, the lift was smaller, +$0.89B, +3.9% and the number of demographics spending more decreased to 60.4%. However, 1 category was again all positive, Race/Ethnic and the performance disparity narrowed to 86.2% – a little more balance. The slow recovery from the big 2022 drop continues. In 2025, inflation was only 0.6%. We’ll see what happens.

Finally – The “Ultimate” Pet Supplies Spending CU consists of 5 people – a married couple, with 3 children, one 18>. They are 45>54 yr old Gen Xers. They are White, but not of Hispanic origin. They have their own business where they both work and at least one has an Advanced College Degree. Their child also works – part time and their household income is $200K>. They live in a rural area in the Northeast and are still paying off the mortgage on their home.

Petflation 2026 – March Update: All Pet Prices Reach Record Highs

It’s time to continue with 2026 Inflation. The Consumer Price Index peaked back in June 2022 at 9.1% then began to slow until it turned up in Jul/Aug 2023. Prices fell in Oct>Dec 23, then turned up Jan>Oct 24 but fell in Nov. However, they rose 10 straight months to a record high in Sep 25, fell Oct>Dec, then rose in Jan>Mar (New Records). The CPI vs last year rose to 3.3% from 2.4% because of a 1% Feb>Mar lift. Grocery prices fell slightly, -0.04% from Feb and their YOY inflation slowed to 1.9% from 2.4%. Even minor price changes can affect consumer pet spending, especially in the discretionary pet segments, so we will continue to publish monthly reports to track petflation as it evolves in the market.

Petflation was +4.1% in Dec 21 while the overall CPI was +7.0%. The gap narrowed as Petflation accelerated. It was 96.7% of the national rate in June 22. National inflation has slowed considerably, but Petflation generally increased until June 23. It passed the CPI in July 22, fell below it from Apr>Jul 24. It passed the CPI in Aug, fell below in Sep>Oct, rose above in Nov, fell below in Dec>Aug 25, then passed it in Sep>Oct & Dec>Mar 26. All reports will include:

  • A rolling 24 month tracking of the CPI for all pet segments and the national CPI. The base number will be pre-pandemic December 2019 in this and future reports, which will facilitate comparisons.
  • Monthly comparisons of 26 vs 25 which will include Pet Segments and relevant Human spending categories. Plus
    1. CPI change from the previous month.
    2. Inflation changes for recent years (25>26, 24>25, 23>24, 22>23, 21>22, 20>21, 19>20, 18>19)
    3. Total Inflation for the current month in 2026 vs 2019 and vs 2021 to see the full inflation surge.
    4. Average annual Year Over Year inflation rate from 2019 to 2026
  • YTD comparisons
    1. YTD numbers for the monthly comparisons #2>4 above

In our first graph we will track the monthly change in prices for the 24 months from Mar 24 to Mar 26. We will use December 2019 as a base number so we can track the progress from pre-pandemic times through an eventual recovery. This chart is designed to give you a visual image of the flow of pricing. You can see the similarities and differences in segment patterns and compare them to the overall U.S. CPI. The year-end numbers from 12 and 24 months earlier are included. We also included and highlighted (pink) the cumulative price peak for each segment. In Mar, Total Pet prices were up 0.8% from Feb. All segments were up & peaked. Supplies (+1.7%), Vet (+0.7%), Food (+0.4%), Services (+0.4%).

In Mar 24, the CPI was +21.5% and Pet was +24.0%. The Services segments inflated after mid-20, while Product inflation stayed low until late 21. In 22, Food prices grew but the others had mixed patterns until July 22, when all rose. In Aug>Oct Petflation took off. In Nov>Dec, Services & Food inflated while Vet & Supplies prices stabilized. In Jan>Apr 23, prices grew every month for all segments except for 1 Supplies dip. In May Products prices grew while Services slowed. In Jun/Jul this reversed. In Aug all but Services fell. In Sep/Oct this flipped. In Nov, all but Food & Vet fell. In Dec, Supp. & Vet  drove prices up. In Jan>Mar 24 Pet prices grew. In April, prices in all but Vet fell. In May, all but Food grew. In June, Products drove a lift. In July, all but Services fell. In Aug, Food drove a drop. In Sep, Products fueled a drop. In Nov all were up. Prices dropped in Mar & Oct>Nov 25, then rose Dec>Mar 26. All, including the CPI, set records in March 26.

  • U.S. CPI – Inflation was below 2% through 2020. It turned up in January 21 and grew until flattening out in Jul>Dec 22. Prices rose Jan>Sep 23, fell Oct>Dec, rose Jan>Oct 24, fell Nov, rose Dec>Sep 25, fell Nov>Dec, but hit record highs in Jan/Feb/Mar 26. 25% of the lift since Dec 19 happened from Jan>Jun 22 – 8% of the time.
  • Pet Food – Prices were at the Dec 19 level Apr 20> Sep /21. They grew & peaked May 23, then got on a roller which continues Jun/Jul, Aug, Sep↔, Oct/Nov , Dec>Mar – a new record. 93% of the lift was in 22/23.
  • Pet Supplies – Supplies prices were high in Dec 19 due to tariffs. They had a deflated roller coaster ride until mid-21 when they returned to Dec 19 prices & stayed there until 22. They turned up in Jan (record). They plateaued Feb>May, grew in June, flattened in July, then turned up in Aug>Oct to a new record. Prices stabilized Nov>Dec, grew Jan>Feb 23. fell in Mar, but the roller coaster hasn’t stopped. Jan>Feb 25, Mar>May, Jun, Jul, Aug, Sep, Oct>Nov, Dec(record), Jan 26, Feb>Mar. Prices are now at a new record high.
  • Pet Services– Inflation is usually 2+%. Perhaps due to closures, prices increased at a lower rate in 2020. In 2021 consumer demand increased but with fewer outlets. Inflation grew in 21 with the biggest lift in Jan>Apr. Inflation was strong in 22 but prices got on a roller coaster. They turned up Jul>Apr 23, fell May. Jun>Aug, Sep>Dec, Jan>Mar 24, Apr, May, Jun, Jul>Nov, Dec>Mar 25, Apr>Aug, Sep, Oct>Mar 26(record).
  • Veterinary – Inflation has been consistent. Prices turned up in Mar 20 and grew through 21. A surge began in Dec 21 which put them above the overall CPI. In May/Jun 22 prices fell below the CPI. However, they rose again & have been above the CPI since July 22. In 23>25 prices grew Jan>May, leveled Jun/Jul, fell Aug, grew Sep>Dec, fell Jan, grew Feb>May, fell Jun>Jul, grew Aug 24>Sep 25, fell Oct>Nov, grew Dec>Mar 26. (records)
  • Total Pet – Petflation is a sum of the segments. In Dec 21 the price surge began. In Mar>Jun 22 the segments had ups & downs, but Petflation grew Jul>Nov, slowed Dec, grew Jan>May 23, fell Jun>Aug, grew Sep/Oct, fell in Nov. In December prices grew through Mar 24 to a record high. Prices fell in April, rose May>Jun, fell Jul>Sep, rose Oct>Nov, fell Dec, rose Jan>Feb 25, fell Mar, grew Apr>Jul, fell Aug, rose Sep, fell Oct>Nov, rose Dec>Mar 26 (record)

Next, we’ll turn our attention to the Year Over Year inflation rate change for March and compare it to last month, last year and to previous years. We will also show total inflation from 21>26 & 19>26. Petflation rose from 2.5% to 3.5% in Sep, fell to 2.6% in Nov, then rose to 3.5% in Dec. In Mar it is 4.3%, 30.3% above the National CPI. The chart will allow you to compare the inflation rates of 25>26 to 24>25 and other years but also see how much of the total inflation since 2019 came from the current surge. We’ve included some human categories to put the pet numbers into perspective.

Overall, prices were up 1.0% from Feb and were +3.3% vs Mar 25, up from 2.4% last month. Grocery prices dropped, -0.04% and inflation slowed to +1.9% from 2.4%. Haircut prices were also down from last month. In Feb, there were no drops. In Dec & Jan there was 1. In Nov there were 6 drops. The national YOY monthly CPI rate of 3.3% is up 37.5% from 24>25 but it’s 61% less than 21>22. The 25>26 rate is above 24>25 for all but Vet, Groceries & Haircuts. In our 2021>2025 measurement you also can see that over 80% of the cumulative inflation since 2019 has occurred in all but 4 segments, Haircuts, Medical, Vet, Pet Services. Service Segments have generally had higher inflation rates so there was a smaller pricing lift in the recent strong increase. Pet Products have a very different pattern. The 21>26 inflation surge provided 98% of their overall inflation since 2019. This happened because Pet Products prices in 2021 were still recovering from a deflationary period. Services expenditures account for 64.0% of the National CPI so they are very influential. Their current CPI is +3.1% while the CPI for Commodities jumped up from 1.2% to 3.4%. Services are the usual inflation driver, but Commodities are behind the current increase. The situation in Pet is closer to the “normal” national situation. Petflation: 4.3%. The CPI for the 2 Service Segments is 5.6%. The Pet Products CPI is 3.1%.

  • U.S. CPI– Prices are +1.0% from Feb. The YOY increase is 3.3%, up from 2.4% in Feb. It peaked at +9.1% back in June 2022. The targeted inflation rate is <2% so we are now 65+% higher than the target. The lift follows stability in Feb, a lift in Jan, stability in Dec and 2 drops in Oct & Nov. The current rate is 37.5% above 24>25 and the 21>26 rate is +24.7%, 82.6% of the total inflation since 2019. The Inflation surge was just starting in March 2021, +2.6%
  • Pet Food– Prices are +0.4% vs Feb. and +2.3% vs Mar 25, up from 1.4%. They are now 21% above the Food at Home inflation rate of +1.9%. Remember that the YOY Pet Food CPI has deflated in 15 of the last 25 months. The 2021>2026 inflation surge has generated 93.6% of the 26.7% inflation since 2019. Inflation began for Pet Food in June 2021, +0.9%, after 12 straight deflationary months. Pet Food prices just reached a new record high.
  • Food at Home – Prices are -0.04% from Feb and the YOY increase fell from 2.4% to 1.9%. This is radically lower than Jul>Sep 2022 when it exceeded 13%. The 31.4% Inflation for this category since 2019 is 5% more than the national CPI but is only in 5th place behind 3 Services expenditures and Total Pet. 82.5% of the inflation since 2019 occurred from 2021>26. This is about the same as the CPI, but we should note that Grocery prices began inflating in 2020>21 then the rate accelerated. It appears that the pandemic supply chain issues in Food which contributed to higher prices started early and foreshadowed problems in other categories and the overall CPI tsunami.
  • Pets & Supplies– Prices were +1.7% from Feb and YOY inflation rose to +3.5% from 1.8%. They still have the lowest rate vs 2019. Prices were deflated for much of 20>21. As a result, the 2021>26 inflation surge accounted for 111.0% of the total price increase since 2019. Prices set a record in Oct 22 then deflated. 3 lifts pushed them to a record high in Feb 23. Prices fell in Mar & the roller coaster continued into 25. They fell Jan/Feb 25, rose Mar>May, fell Jun, rose Jul, fell Aug, rose Sep, fell Oct>Nov, rose Dec (record), fell in Jan, rose Feb>Mar – a new record.
  • Veterinary Services– Prices are +0.7% from Feb and 5.6% from 2025, up from 5.3%. They are #2 in inflation vs last year, behind Pet Serv. but still #1 in the increase since 2019, +55.5% and 21, +43.9%. For Veterinary, high annual inflation is the norm. However, the rate has increased during the current surge, especially since 23. They have the highest Mar avg rate in 26, but only 79% of the cumulative inflation since 2019 occurred from 2021>26.
  • Medical Services – Prices turned sharply up at the start of the pandemic but then inflation slowed and fell to a low rate in 20>21. Prices rose +0.1% from Feb, but inflation vs last year slowed to +3.7% from +4.1%. Medical Services are not a big part of the current surge as only 58.5% of the 22.9%, 2019>26 increase happened from 21>26.
  • Pet Services – Inflation slowed in 20 but grew in 21. In 24 prices surged , especially in Jul>Nov. Prices fell Dec>Mar 25 to 3.9%. Apr grew, May fell, June rose, Jul rose to 6.3%. Inflation fell to 5.8% in Aug & to 4.2% in Nov. In Dec>Mar 26 it rose to 7.8%. They are #1 vs 25 and #2 vs 21 & 19. 76.9% of their 19>25 inflation is from 21>26.
  • Haircuts/Other Personal Services – Prices are -0.3% from Feb but +4.5% from Mar 25. 20 of the last 27 months have been 4.0+%. Inflation has been pretty consistent. 68.1% of the 19>26 inflation happened 21>26.

Total Pet– Petflation rose to 4.3% from 3.3%. Only Veterinary & Pet Services had a higher rate. It is 3.3 times the 24>25 rate and 30.3% more than the current U.S. CPI. Plus, it is 43.3% above the 3.0% average March rate since 1997. Feb prices rose 0.8%, driven by all. The Feb>Mar increase was well above the 0.3% 97>25 average change, but expected. Since 1997, there have been only 5 Feb>Mar price drops. Another factor in the current CPI lift was that prices fell 0.2% in Feb>Mar 25. The recovery definitely slowed. Now, we’ll look at YTD data.The 25>26 rate is equal to or higher than 24>25 for all, but Veterinary. The 22>23 inflation rate was the highest for Tot Pet, Pet Food, Groceries & Pet Services. 21>22 has the highest rate for Pet Supplies & the Natl CPI. 23>24: Vet; 20>21: Haircuts; 19>20: Medical Services. The average national inflation rate in the 7 years since 2019 is 3.8%. Only 3 of the categories are below that rate – Medical Services (3.0%), Pet Supplies (1.9%) and Pet Food (3.4%). It is no surprise that Veterinary Services has the highest average rate (6.5%), but all 4 other categories are +4.0% or higher.

  • U.S. CPI – The 25>26 rate is 2.7%, the same as 24>25 but down 16% from 23>24. It is also 66.2% less than 21>22 and 29% below the average increase from 2019>2026. However, it’s still 45% more than the average increase from 2018>21. 83% of the 29.5% inflation since 2019 occurred from 2021>26. Inflation is a problem that started recently.
  • Pet Food – Ytd prices are still inflating, 1.7%, up from 1.4%. That’s a big increase from -0.5% in 24>25, but it is still below 3.0% in 23>24 and even the 2.0% 18>20 average. Pet Food has the highest 22>23 rate but is only #6 in the 21>26 rates and #8 in 19>26. Deflation in the 1st half of 2021 kept YTD prices low then they surged in 22 and especially in 23. 92% of the inflation since 2019 occurred from 2021>26.
  • Food at Home – The 25>26 inflation rate is the same as 24>25, but at 2.1%, it is down 89% from 22>23, 76% from 21>22 and even 40% less than 20>21. However, it is 2.1 times higher than the average rate from 2018>20. It is only in 5th place for the highest inflation since 2019 but still beat the U.S. CPI by 7.1%. You can see the impact of supply chain issues on the Grocery category as 82% of the inflation since 2019 occurred from 2021>26.
  • Pets & Pet Supplies – A roller coaster, prices rose Jan>Feb 24, fell Mar>Apr, rose May>Jun, fell July, rose Aug, fell Sep>Oct, rose Nov>Dec, fell Jan>Feb 25, then rose Mar>May. Prices vs 24 flipped to deflation in June, back to +0.7% in July, fell to 0.0% in Aug, rose Sep>Dec, fell Jan 26, rose Feb>Mar. Supplies still have the lowest inflation since 2019. Their biggest YOY lifts since 2019 were in 22 & 23. The 2021 deflation created an unusual situation. Prices are up 13.8% from 2019 but 112% of this lift happened from 21>25. Prices are up 15.5% from their 2021 “bottom”.
  • Veterinary Services – Inflation was high in 2019 and steadily grew until it took off in late 2022. The rate may have peaked in 2023, but it is still going strong in 2026, +6.1%, the 2nd  highest on the chart. However, they are still #1 in inflation since 2019 and since 2021. At +6.5%, they have the highest average inflation rate since 2019. It is 71% higher than the National Average but 2.2 times higher than the Inflation average for Medical Services. Strong Inflation is the norm in Veterinary Services.
  • Medical Services – Prices went up significantly at the beginning of the pandemic, but inflation slowed in 2021. In Mar 2026 it is 3.9%, 30% above the 3.0% 2019>26 average rate. We should also note that 3.9% is 3 times higher than the 1.3% low point in 23>24.
  • Pet Services – After falling in late 2023, prices surged in 2024, then fell in 2025 until an Apr>Aug lift followed by a Sep>Nov dip and a Dec>Mar 26 lift. The 25>26 6.9% CPI is #1 on the chart, passing Veterinary. It is 35% above their 19>26 avg and more than double their 2018>20 avg. Pet Services is also 2nd in both 19>26 and 21>26 inflation.
  • Haircuts & Personal Services – The services segments, essential & non-essential, were hit hardest by the pandemic. The industry responded by raising prices. 2026 inflation is 4.8%, 15.8% below its 20/21 peak, but 47.7% above the 18>20 average. Consumers are paying over 35% more than in 2019, which usually reduces the purchase frequency.
  • Total Pet – Petflation is 3.7%, up 95% from 24>25, but 7.5% less than 23>24. However, It’s 63 % more than their 18>21 avg and 37% above the CPI. Petflation is growing again. Except for Mar/Aug/Oct/Nov, Pet prices rose in 25, which continued in Jan>Mar 26. This is primarily being driven by a flip from deflation to inflation in Pet Products and continued strong inflation in Services, especially Non-Vet.

The Petflation recovery paused in Aug 24, came back Sep>Oct, paused in Nov, resumed in Dec>Jan 25, paused in Feb, restarted in Mar and paused Apr>Sep. It improved Oct/Nov but paused in Dec>Mar 26. We tend to focus on the monthly, YOY inflation in the current year and ignore the fact that inflation is cumulative. Pet prices are 29.0% above 2021 and 33.8% higher than 2019. Those are big lifts. In fact, March prices for the National CPI, Total Pet and all pet segments reached new record highs. Only Supplies prices (+15.4%) are less than 26.7% higher than 2019. Since price/value is the biggest driver in consumer spending, inflation will affect the Pet Industry. Services will be the least impacted as it is the most driven by high income CUs. Veterinary will continue to see a reduction in visit frequency. Pet Parents will just pay more. The product segments will see a more complex reaction. Supplies are more discretionary so we will likely see a reduction in purchase frequency. In Pet Food, the most needed segment, some Pet Parents may even choose to downgrade their Pet Food. However, the biggest impact in both product segments will be a strong movement to online purchasing and private label. We saw proof of this at both GPE 25 & SZ 25 as a huge # of exhibitors offer OEM services. At GPE 26, this trend continued. Strong, cumulative inflation has a widespread impact. We’ll continue to monitor the situation.

Retail Channel $ Update – January Monthly & February Advance

In February, YOY Commodities’ inflation rose slightly to 1.2% from 1.0%. Even with a low inflation rate, high cumulative inflation vs 21 can still impact consumer spending and slow $ales growth.  We saw evidence of this in February. Total Retail $ were +3.6% vs 25, 21.8% below the average 92>25 lift and Relevant Retail was +3.8%, still -18.5% below the February average. The situation is complex and there is still a long road to full recovery. We’ll continue to track the retail market with data from 2 reports provided by the Census Bureau and factor in a targeted CPI.

The Census Bureau Reports are the Monthly and the Advance Retail Sales Reports. Both are derived from sales data gathered from retailers across the U.S. and are published monthly at the same time. The Advance Report has a smaller sample size so it can be published quickly – normally, 2 weeks after month end. The Monthly Report includes data from all respondents, so it takes longer to compile the data – about 6 weeks. Although the sample size for the Advance report is smaller, the results over the years have proven it to be statistically accurate with the Monthly reports. The biggest difference is that the full sample in the Monthly report allows us to “drill” a little deeper into the retail channels.

We will begin with the January Monthly Report and then go to the February Advance Report. Our focus is comparing to last year but also 21 & 19. We’ll show both actual and the “real” change in sales as we factor inflation into the data.

Both reports include the following:     (Note: January monthly data = Ytd)

  • Total Retail, Restaurants, Auto, Gas Stations and Relevant Retail (removing Restaurants, Auto and Gas)
  • Individual Channel Data – This is more detailed in the Monthly reports, and we’ll focus on Pet Relevant Channels.

The data will be presented in detailed charts to facilitate visual comparison between groups/channels. The charts will show 11 separate measurements. To save space they will be displayed in a stacked bar format for the channel charts.

  • Current Month change – % & $ vs previous month
  • Current Month change – % & $ vs same month last year and vs 2021.
    • Current Month Real change vs last year and vs 2021 – % factoring in inflation
  • Current Ytd change – % & $ for this year vs last year, 2021 & 2019.
    • Current Ytd Real change % for this year vs last year and vs 2021 and 2019
  • Monthly & Ytd $ & CPIs for this year vs last year and vs 2021 which are targeted by channel will also be shown. (CPI Details are at the end of the report)

First, the January Monthly. All were down from December but there were only 2 actual sales drops – monthly/ytd vs 25 in Gas Stations. We should note: Gas Stations are still selling a little more product than in 2019. Also, Relevant Retail is all positive again. They have been all positive in 20 of the last 22 months.            ($ are Not Seasonally Adjusted)

The December Monthly is $0.3B less than the Advance report. Restaurants: -$0.1B; Auto: +$0.4B; Gas Stations: +$0.5B; Relevant Retail: -$1.3B. Relevant Retail was the driver in the $ales drop vs December, but all were down. A Dec>Jan decrease in Total Retail  has happened every year since 1992. However, the 17.4% drop was 17.5% less than average. There were 2 drops in actual sales – Monthly/Ytd vs 25 for Gas Stations. There were no “real” sales drops, the same as December. All but Gas Stations were all positive. Restaurants still have the biggest increases vs 21 & 19 but Relevant Retail stayed at the top of “real” performance vs 2019. However, only 53.8% of their growth is real.

Now, let’s see how some Key Pet Relevant channels did in January in the Stacked Bar Graph Format

Overall– All 11 were down from December. Vs Jan 25, 9 were actually and 6 “really” up. Vs Jan 21, 10 were up but only 5 were real lifts. Vs 2019, Dept Strs & Off/Gift/Souv were actually & really down, but Home/Hdw was also really down.

  • Building Material Stores – The pandemic focus on home has produced $ growth of 27.2% since 2019. Prices for the group have inflated 26.3% from 21 and 28.9% from 2019, which is having an impact. HomeCtr/Hdwe Sales vs Dec were -11.0% & -17.6% for Farm Stores. Vs other years, HomCtr/Hdwe are actually up & really down for all. Farm stores are actually up for all, but their Real $ were down vs 25 & 21. Bldg/Mat group’s 19>26 real growth was -1.3%. (avg -0.2%) HomeCtr/Hdwe: Jan: 2.0%; Avg 19>26 Growth: 3.2%, Real: -0.5%; Farm: Jan: +5.3%; Avg: 5.2%, Real: 1.5%
  • Food & Drug – Both are essential. Except for the COVID food binge, they tend to have smaller changes in $. Vs Dec: Supermarkets: -3.4%; Drug: -14.2%. In terms of inflation, the Groceries rate is 7 times higher than Drug/Med products. Drug Stores are positive in all measurements and 64.0% of their 2019>26 growth is real. Supermarkets’ actual $ are up in all comparisons, but they are only “really” up vs 2019 and only 9.2% of their 19>26 increase is real growth. Supermarkets: Jan: +1.8%; Avg 19>26: +4.5%, Real: +0.5%; Drug Stores: Jan: +1.2%; Avg: +4.3%, Real: +2.9%.
  • Sporting Goods Stores – They also benefited from the pandemic in that consumers turned to self-entertainment, especially sports & outdoor activities. Sales are -45.3% from Dec, but their only negatives are actual & real vs 21. Prices stopped deflating vs last year. Deflation started in April 23 and was a big change from +1.1% in 22>23 & +7.9% in 21>22. This caused 74% of their 48% lift since 2019 to be real. Jan: 4.1%; Avg 19>26: +5.7%; Real: +4.4%
  • Gen Mdse Stores – Sales were -23.1% vs Dec. All YOY comparisons were up for $ Strs & SupCtr/Clubs. Dept Stores are negative in all comparisons but actual vs Jan 21. Their Actual sales are even -33.6% from 19 (Real: -40.6%). The other channels have an average of 46.9% in real growth. SupCtr/Club: Jan:+3.5%; Avg 19>26: 5.2%, Real: 2.6%; $/Value Strs: Jan: +5.6%; Avg: +5.6%, Real: +3.0%; Dept. Strs: Jan: -9.8%; Avg: -5.7%, Real: -7.2%.
  • Office, Gift & Souvenir Stores– Sales fell -35.8% from Dec. They are actually up vs Jan 21. All others are down. Their recovery started late. It was slowly restarting in Jun/Jul, but their progress had slowed. It took off in Oct, slowed in Nov, grew in Dec, then slowed in Jan. Recovery takes some time. Jan: -2.7%; Avg Growth Rate: -0.9%, Real: -2.4%
  • Internet/Mail Order – Sales are -25.9% from Dec to $116.1B, a Jan record. All YOY measurements are positive, but their YOY growth, +7.8%, is only 56.5% of their average since 2019. However, 82.3% of their 146.8% growth since 2019 is real. Jan: +7.8%; Avg Growth: +13.8%, Real: +12.0%. As expected, they are by far the growth leader since 2019.
  • A/O Miscellaneous – Pet Stores are 22>24% of total $. In May 2020 they began their recovery which reached $100B for the 1st time in 21. In 22 their $ dipped in Jan, Jul, Sep>Nov, rose Dec, fell Jan>Feb 23, grew Mar>May, fell Jun>Aug, rose Sep>Nov, fell Dec>Jan 24, grew Feb>May, fell Jun>Sep, grew Oct, fell Nov, rose Dec, fell Jan>Feb, grew Mar>May, fell Jun>Sep, rose Oct, fell Nov, rose Dec, fell Jan 26. All comparisons are positive, and they are #2 in the increase vs 2019 but now #1 vs 2021. Also, 78.7% of their 97.6% growth since 2019 is real. Jan: +12.6%; Avg 19>26: 10.2%, Real: +8.5%

Jan had its usual drop vs Dec, but the Rel Retl drop was 24% below avg. However, all small channels were down. The YOY lift vs 25 was below avg for Total: -36% & Relevant Retl: -15%, but 4 big groups & 9 smaller channels had lifts. Also, prices are only deflating in Auto & Gas Stations, but cumulative inflation has an impact, as only 5 channels were really up vs Jan 21. The Recovery is slow. In Feb, the commodities CPI rose from 1.0% in Jan to 1.2%. Let’s see if it impacts Retail.

Jan>Feb sales were down for all but Auto. A Jan>Feb Total Retail drop has happened in 65% of the years since 1992. The -3.1% drop is 4.3 times the -0.7% avg. BTW: The -5.3% Jan>Feb drop by Relevant Retail was 2.3 times bigger than their -2.3% avg. There were 2 YOY $ drops, the same as Jan. 4 Big Groups were up vs 25 but the Total Retail lift of 3.6% vs Feb 25 was 22% below their +4.6% 92>25 avg. Plus, the Relevant Retail 3.8% increase vs Feb 25 was 18.5% below their +4.6% avg. Inflation is still a factor. The CPI for all commodities rose to 1.2% from 1.0% vs last year but it is still +19.5% vs 21. There is some good “real” news. Like the Jan Monthly, no “real” measurement was down. Plus, Gas Stations are again selling more Gas than in 2019. Also, 4 Big Groups are again all positive, the same as Dec/Jan. Note: Relevant Retail has now been all positive in 21 of the last 23 months.

Overall Inflation Reality– The Total Retail CPI rose to only 1.2% but the $ lift vs 25 was still 22% below avg. The Restaurant CPI slowed to +3.8% but their $ lift was still 6% below avg. Gas prices rose to -5.5%. They are still in turmoil. Auto inflation is -0.9% vs 25 but +18.6% vs 21. Sales were +3.7% vs 25, 13.4% below their 4.3% avg change. Inflation rose to 2.2% for Relevant Retail and their lift was 18.5% below avg, but they are again all positive. Progress has slowed in 2026.

Total Retail – Since Jun 20, every month but Apr 23, Jun 24 & Feb 25 has set a monthly $ales record. In 2023>26, Sales got on a roller coaster. Up Jul>Aug, down Sep, up Oct>Dec, down Jan 24, up Feb>Mar, down April, up May, down Jun, up Jul>Aug, down Sep, up Oct>Dec, down Jan>Feb 25, up Mar, down Apr, up May, down Jun, up Jul>Aug, down Sep, up Oct, down Nov, up Dec, down Jan>Feb. Prices are 1.2% and YOY $ are +3.6%, 22% below avg. 43% of 19>26 growth is real. Inflation slowed but cumulative inflation is still impacting sales. Growth: 25>26: 3.3%; Avg 19>26: +6.0%, Real: +2.9%.

Restaurants – They were hit hard by the pandemic and didn’t begin recovery until March 2021. However, they have had strong growth since then, exceeding $1T for the 1st time in 2023. February $ are up vs 25 and they have the biggest lifts vs 21 & 19. Inflation slowed to 3.8% vs last year, but it is +29.8% vs 21 and +35.1% vs 19. Their 5.0% YOY lift is 6% below their +5.4% 92>25 avg. They are all positive again, but just 34% of their 65% growth since 2019 is real. They fell from 3rd  to 4th in performance. Recovery started late but inflation started early. Growth: 5.0%; Avg 19>26: +7.4%, Real: +2.9%.They just account for 13.8% of Total Retail $, but their strong growth has helped Total Retail.

Auto (Motor Vehicle & Parts Dealers) – They overcame the stay-at-home attitude with great deals and advertising. They finished 2020 up 1% vs 2019 and hit a record $1.48T in 2021 but much was due to high inflation. In 22, sales got on a rollercoaster. Inflation started to drop mid-year, but it caused 4 down months in actual $. Their YE real 22 sales numbers were even worse, -8.2% vs 21 and -8.9% vs 19. 23 started a sales rollercoaster but the $ hit a record, $1.595T. $ fell in Jan 24, grew Feb>Mar, fell Apr, grew May, fell June, grew Jul>Aug, fell Sep, grew Oct, fell Nov, grew Dec, fell Jan>Feb 25, grew Mar, fell Apr>Jun, rose Jul>Aug, fell Sep, rose Oct, fell Nov, rose Dec, fell Jan, rose Feb. Feb $ were +3.7% vs 25, below the 4.3% avg. They are again all positive but just 36% of 19>26 growth is real. Growth: 2.0%; Avg 19>26: +5.2%, Real: +2.1%

Gas Stations – Gas Stations were hit hard by “stay at home”. They started recovery in Mar 21, and inflation began. Sales got on a rollercoaster in 22 but set a record, $583B. Inflation started to slow in Aug and prices slightly deflated in Dec & Feb 23, then strongly fell in Mar>Jul to -20.2%. In Sep they were +2.7% but began deflating to -4.2% in Feb 24. In Mar>May $ grew, fell Jun, rose July, fell Aug/Sep, rose Oct, fell Nov>Feb 25, rose Mar>May, fell Jun, rose Jul, fell Aug>Oct, up Nov, fell Dec>Jan, rose Feb. Feb $ vs 25: -0.7% (4.3% avg). Only down vs 25. Real $ vs 19 are again positive. Growth: -1.3%; Avg 19>26:+3.5%, Real: +0.3%. They show the cumulative impact of inflation can be positive & negative.

Relevant Retail – Less Auto, Gas and Restaurants– They account for ≈60% of Total Retail $ in a variety of channels. Their only down month until Feb 25 was Apr 20, and they led the way in Retail’s recovery. Sales got on a roller coaster in 22, but all months set new records with Dec reaching a new all-time high, $481B, and an annual record of $4.81T. In 23, the roller coaster continued. A Dec lift set a new monthly record of $494.7B & an annual record of $4.997T. $ales got back on the roller coaster in 24. The ride continued as $ rose Oct>Jan 25, fell Feb, rose Mar>May, fell Jun, rose Jul, fell Aug>Sep, rose Oct>Dec, fell Jan>Feb 26. The Feb 3.8% YOY lift is 18.5% below their 92>25 avg of +4.6%, but they are all positive again and 53.1% of their 53.5% 19>26 growth is real, again #1 in Big Group performance. Growth: 3.9%; Avg 19>26: +6.3%, Real: +3.6%. In 2024 their inflation rate fell from 3.2% to 0.1%. It rose in 25 to 1.8% in Sep then slowed to 1.5% in Oct>Nov, rose to 2.0% in Dec>Jan & 2.2% in Feb. YOY Inflation is low, but its cumulative impact can slow growth.

YOY inflation is low, but cumulative & impending lifts can affect sales. In Feb, 2 actual YOY $ comparison were negative, the same as Dec/Jan. In Oct>Nov, there was 1 real drop. That fell to 0 in Dec>Feb. In Oct, all were up vs last year with below avg lifts. In Nov only Auto was down but the lifts were all below avg. In Dec, all were up and Relevant Retl’s lift was above avg. In Jan, 3 lifts, all below avg. In Feb, 4 lifts, all below avg. In Oct/Nov, 3 big groups were all positive. In Dec, there were 4, which has continued through Feb. Relevant Retail has now been all positive in 21 of 23 months. As expected, Feb Total Retail sales fell vs Jan, but the -3.1% drop was 4.3 times more than the -0.7% avg. Recovery is still slow.

Here’s a more detailed look at February by Key Channels in the Stacked Bar Graph Format

  • Relevant Retail: Ytd Growth: +3.9%; Avg 19>26: +6.3%; Real: 3.6%. % Real Growth: 53.1%. 9 of 11 were down from Jan. Vs Feb 25: 8 were up, 6 Real. Vs Feb 21: 11 were up; 7 Real. Vs 19: Dept Stores were down & real Furniture Stores.
  • All Department Stores – This group was struggling before the pandemic hit them hard. They began recovery in March 21. Sales are +18.1% from Jan but all YOY measurements but actual vs 21 are negative. Their -6.0% Feb YOY drop is 36% more than their -4.4% avg. Ytd Growth: -7.8%; Avg 19>26: -5.6%; Real: -7.2%. % Real growth: None
  • Club/SuprCtr/$- They fueled a big part of the recovery because they focus on value which has broad consumer appeal. $ales are -6.7% from Jan, but they are up in all comparisons but real vs Feb 25. Their 1.4% YOY Feb lift is -83% below their 92>25 avg of +8.2%. Ytd Growth: 2.6%; Avg 19>26: +5.1%; Real: 2.4%. % Real Growth: 43.9%
  • Grocery- They depend on frequent purchases, so their changes are usually less radical. $ales are -10.5% from Jan. They are actually down vs Feb 25 but really down for all but vs 2019. Cumulative inflation has hit them hard. Their -0.2% YOY Feb drop is a big change from a +3.0% avg. Ytd Growth: 0.8%; Avg 19>26: +4.4%; Real: 0.4%. % Real Growth: 7.4%
  • Health/Drug Stores – Many stores are essential, but consumers visit less frequently than Grocery stores. $ are -3.7% from Jan, but they are positive in all YOY comparisons. Inflation has been relatively low, so it is surprising that their +2.5% YOY lift vs Feb 25 is 49.4% below avg. Ytd Growth: 1.8 %; Avg 19>26: +4.3%; Real: 2.8%. % Real Growth: 62.9 %
  • Clothing and Accessories – Clothes mattered less if you stayed home. That changed in March 2021 with strong growth through 2022. Sales are +7.8% from Jan and positive in all YOY measurements. $ales are +7.0% vs Feb 25, 2.2 times more than their 3.2% avg. Ytd Growth: 6.2%; Avg 19>26: +3.6%; Real: 2.6%. % Real Growth: 68.4%.
  • Home Furnishings – In mid-2020 consumers’ focus turned to their homes and furniture became a priority. Inflation is up to 4.5% in Feb. $ are -1.5% from Jan and are only actually up vs 2019 & vs Feb 21. YOY vs Feb 25, they are -5.6%, far below their 3.1% avg lift. Ytd Growth: -4.8%; Avg 19>26:+2.2%; Real: -0.2%. % Real Growth: None.
  • Electronic & Appliances – They have had many issues. Sales fell in Apr>May of 2020 and didn’t reach 2019 levels until March 21. $ are -5.5% from Jan but they are up in all comparisons. Strong deflation made real sales very high. Sales are +4.9% vs Feb 25, 2.4 times above the 2.1% avg. Ytd Growth: 4.6%; Avg 19>26: 0.7%; Real: 3.9%. % Real Growth: 100+%
  • Building Material, Farm & Garden & Hardware – They truly benefited from the consumers’ focus on home. In 2022 the lift slowed as inflation grew to double digits. Prices turned up again in Apr>Sep 25, dropped Oct/Nov, rose Dec/Jan to 5.6%, fell to 4.8% in Feb. Sales are -3.0% from Jan but are actually up and really down for all YOYs but 2019. Sales vs Feb 25 were +3.7%, 4.4% below their 3.9% Avg. Ytd Growth: 3.1%; Avg 19>26: 4.0%; Real: 0.4%. % Real Growth: 8.5%
  • Sporting Goods, Hobby and Book Stores – Consumers turned their attention to recreation and Sporting Goods stores sales took off. Book & Hobby Stores recovered more slowly. They have been on a sales roller coaster since June 24 and $ are -3.3% from Jan. All other comparisons are positive. YOY Sales vs Feb 25 are +11.5%, 4 times more than their 2.8% avg. Ytd Growth: +9.2%; Avg 19>26: +4.6%; Real: 3.8%. % Real Growth: 80.6%.
  • All Miscellaneous Stores – Pet Stores have been a key part of the strong and growing recovery of this group. They finished 2020 at +0.9% but sales took off in March 21 and have continued to grow. Sales are -2.0% vs Jan, but positive in all comparisons. They are 2nd in the % increase vs 19 & vs 21. Plus, their 11.3% YOY Jan lift is 2.7 times more than their 92>25 avg of +4.1%. Ytd Growth: +11.6%; Avg 19>26: +7.9%; Real: 6.1%. % Real Growth: 73.3%.
  • NonStore Retailers – 90% of their $ comes from Internet/Mail Order/TV. The pandemic accelerated online spending. They ended 2020 +21.4%. The growth continued in 2021 as sales exceeded $100B for the 1st time and they broke the $1 Trillion barrier. $ are -5.8% from Jan and their YOY lift of 7.5% is -22.8% below the 9.7% avg. However, they are positive in all comparisons. Ytd Growth: 7.3%; Avg 19>26: +12.7%; Real: 10.8%. % Real Growth: 80.4%.

Recap – Driven by Relevant Retail, the Pandemic recovery was widespread by Y/E 21. In 22 we were hit with the strongest inflation in 40 years. Inflation has slowed considerably from its Jun 22 peak, but only 1 smaller channel is deflating. Deflation helps, but cumulative inflation can still have a negative impact – slowed YOY growth and even sales drops. As expected, $ fell from Jan for 9 of 11 channels. 7 of the 9 drops were above avg – Not Good! The biggest concern is still YOY drops and smaller lifts. Relevant Retail’s 3.8% lift vs Feb 25 was 18.5% below avg. 8 channels had a YOY lift vs last year, 1 less than Jan. 4 of the 8 lifts were above avg, 1 more than Jan, the same as Dec but far less than 7 in Oct. There are multiple factors slowing growth, but the major one is high prices from cumulative inflation. December is still the biggest retail month of year, and February is usually the worst. Total & Relevant Retail had the most sales in history for both months. The Feb Yoy lift was -35% below avg for Total and -18.5% below for Relevant. The situation is a little better than January as 7 of 11 channels (8 in Jan) had a below avg lift or a drop vs Feb 25. We’ll see what happens.

Here are the Jan/Feb inflation rates for the CPIs used to calculate the impact of inflation on retail groups and channels. This includes special aggregate CPIs created with the instruction and guidance of the US BLS. I also researched data from the last Economic Census to review the share of sales by product category for the various channels to help in selecting what expenditures to include in specific aggregates. Of course, none of these specially created aggregates are 100% accurate but they are much closer than the overall CPI or available aggregates. The data includes the CPI changes vs 21 to show cumulative inflation. Note: Jan Monthly = Ytd

Monthly YOY CPI changes of 0.2% or more are highlighted. (Green = lower; Pink = higher)

Here are some answers to some obvious questions. Note: Product Prices rose but changes by Channel were mixed.

  1. Why is the group for Nonstore different from the Internet?
    • Non-store is not all internet. It also includes Fuel Oil Dealers, the non-motor fuel Energy Commodity.
  2. Why is there no Food at home included in Nonstore or Internet
    • Online Grocery purchasing is becoming popular, but almost all is from companies whose major business is brick ‘n mortar. These online sales are recorded under their primary channel.
  3. 5 Channels have the same CPI aggregate but represent a variety of business types.
    • They also have a wide range of product types. Rather than try to build aggregates of a multitude of small expenditure categories, it seemed better to eliminate the biggest, influential groups that they don’t sell. This method is not perfect, but it is certainly closer than any existing aggregate.
  4. Why are Grocery and Supermarkets only tied to the Grocery CPI?
    • According to the Economic Census, 76% of their sales comes from Grocery products. Grocery Products are the driver. The balance of their sales comes from a collection of a multitude of categories.
  5. What about Drug/Health Stores only being tied to Medical Commodities.
    • An answer similar to the one for Grocery/Supermarkets. However, in this case Medical Commodities account for over 80% of these stores’ total sales.
  6. Why do SuperCtrs/Clubs and $ Stores have the same CPI
    • While the Big Stores sell much more fresh groceries, Groceries account for ¼ of $ Store sales. Both Channels generally offer most of the same product categories, but the actual product mix is different.


2024 Pet Food Spending was $40.04B – Where did it come from…?

As we continue to drill ever deeper into the demographic Pet spending data from the US BLS, we have now reached the level of individual Industry segments. We will start with Pet Food, now the 2nd largest, but arguably the most influential. We have noted the trendy nature of Pet Food Spending. In 2018 we broke a 20 year pattern – 2 years up then spending goes flat or turns down. We expected a small increase in 2018 but got a $2.27B decrease. This was due to the reaction to the FDA warning on grain free dog food. The warning lost credibility and spending rebounded in 2019, +$2.35B. In 2020 the market was hit by a bigger outside influence – the pandemic. In Pet Food, it created a wave of panic buying and a $5.65B lift. The panic buying was over, so spending fell -$2.44B in 2021. In 2022 spending returned to more “normal” behavior with a strong $4.29B, +12.5% increase to $38.69B. In 2023, spending skyrocketed with a record $6.81B lift and reached $45.5B. In 2024, spending fell -$5.46B, -12.0% to $40.04B, now 2nd to Veterinary. Let’s take a closer look.

First, we’ll see which groups were most responsible for the bulk of Pet Food spending and the -$5.46B decrease. The first chart details the biggest pet food spenders for each of 10 demographic categories. It shows their share of CU’s, share of pet Food spending and their spending performance (Share of spending/share of CU’s). To reach the 60% goal, 4 are different from Total Pet – Education, Occupation, Area and CU Size. The categories are presented in the order that reflects their share of Total Pet Spending. The big difference is that $70K> income has the smallest share of Food $. This difference is magnified in performance. Being Married is the most important factor in Food spending. In Total Pet and other segments, Income is the most important. Food spending is also more balanced than Total Pet Spending. This is evident by the fact that the Performance of only 5 groups exceeds 120%. In Total Pet there were 7. In 2024, Pet Food accounted for 62.6% of Pet Products $ and 33.7% of Total Pet $, down significantly from 66.4% and 38.7% in 2023. Pet Food is no longer the largest segment (Veterinary) but it is still very important & impactful to the Pet Industry.

  1. Housing – Homeowners (81.3%) – up from 77.6%. Homeownership is a huge factor in pet ownership and pet spending. In 2024, homeowners gained share and their performance rose from 119.2% to 125.3%. They rejoined the 120% club and are tied for 4th in importance. Only w/o Mtge spent more, +$1.3B. W/Mtge were -$4.1B. The increase in share and performance was driven by a -$2.7B, -26.5% drop by Renters.
  2. Race/Ethnic – White, not Hispanic (83.4%) – up from 79.9%. This large group accounts for the vast majority of spending in every segment. They gained share and their performance increased to 125.3% from 120.4%, but this category stayed #3 in terms of importance in Pet Food Spending. Hispanics, African Americans and Asians account for 33.9% of U.S. CU’s & they spend 16.6% of Food $, down from 20.1% in 2023. Only Asians spent more, +$0.55B. Whites were -$2.94B, -8.1%. Minorities were -$2.53B, -27.6%. This % disparity drove the share/performance lifts.
  3. Area – Suburban + Rural (72.7%) down from 73.8%. Their performance fell from 112.7% to 112.0% and their importance dropped to #9, from #8. All segments spent less. The Suburbs had the biggest $ drop, -$2.73B and Center City had the smallest, -$1.01B. Overall, the drop was rather balanced.
  4. Income – Over $70K (66.2%) – up from 61.0%. Their performance rose from 120.9% to 126.4% but they stayed 2nd in importance. High income is still very important in Pet Food Spending but is not at the top of the list. The 50/50 $ divide rose from $93K in 2023 to $98K in 2024 but it is still 6% below the average CU income. Only $40>49K, +$0.56B and 70>99K, +$0.53B spent more. The biggest drop was by <$40K groups, -$4.68B. The $100K> were all down, but the drop was only -$1.8B. The share and performance for $70K> strongly increased because they were only down  -$1.27B, -4.6%, while <$70K was -$4.19B, -23.6%.
  5. # in CU – 2/3 people (60.0%) – up from 54.7%. Their performance also rose from 114.7% to 125.3% and their rank is now tied for 4th. Only 2 people CUs spent more, +$0.43B, +2.6%. In 2024, 2 & 3 People CUs spent -$0.88B, 3.5% less. In 2023 they spent $3.5B more – a big change. Singles led the way down with a -$3.09B, -29.9% decrease in Food spending. Together, 1,4 & 5+ were -$4.58B, -22.2%. This caused the big lifts in share & performance.
  6. Occupation – Wage & Salaried + Self-employed (65.3%) – down from 66.9% – The group’s performance is even lower from 98.7% to 96.0%. Occupation is again last in importance. Only Mgrs/Prof, +$0.91B & All Other, Unemployed, +$0.14 spent more. The widespread spending decreases caused the drops in share & perform ance.
  7. Education – Assoc. Degree> (67.0%) – up from 64.7%. Performance rose from 110.9% to 113.6% but higher education fell from 6th to 8th in importance. Only Associates & HS grads w/some college spent more. Assoc.> were -$2.61B, -8.9%. <Assoc. were -3.09B, -19.2%. This caused the lifts in share and performance.
  8. CU Composition – Married Couples (64.0%) – up from 59.4%. They gained share and their performance rose from 123.3% to 133.3%. They stayed #1 in importance. Only Married, Couple Only & Child 18> CUs spent more. Married CUs were -$1.41B, -5.2%. All others were -$4.05B, -21.9%. This caused the Married Group’s big lifts.
  9. # Earners – 2+ CU, 1 or 2 Earners (59.7%) – up from 57.4% Their performance also rose from 114.3% to 119.2% and they moved from 9th to 6th in importance. Only No Earner, 2+ CUs spent more, +$0.60B. The 1 or 2 Earners, 2+ CUs spent -$2.17B, -8.3% less. All other CUs were -$3.29B, -17.0%. This drove the lift in share & performance.
  10. Age – 35>64 (60.0%) – up from 53.5%. Their performance rose from 102.5% to 115.8% & age moved up from #8 to #7 in importance. All but 45>64 spent less, the reverse of 2023. Age Share: 25>34: 13.9%; 35>44: 17.6%;45>54: 20.6%; 55>64: 21.8%; 65>74: 16.4%. 35>64 have the 3 highest incomes but there’s still some Balance!

The 4 top performers for Pet Food are the same as Total Pet. In 2023 there was a record lift that was widespread and more balanced. This is best illustrated by the fact that in 2023 the performance for only 3 groups exceeds 120% with the highest at 123.3%. In 2024, there was a huge drop and 120+% rose to 5, with the highest at 133.3%. To put the current balance situation into better perspective, we should note that in 2020 there were 8 at 120+%, 5 over 130%.

Now, we’ll look at 2024’s best and worst performing Pet Food spending segments in each category.

Almost all of the best and worst performers are the ones that we would expect. 2024 produced just 1 surprise winner – Married, + Adults in a repeat. There are 7 different winners from 2023 and 8 different losers. This total is 4 more than 2023, which had 6 new winners and 5 new losers. More new losers reflects the widespread nature of 2024’s huge decrease in Pet Food spending. Changes from 2023 are “boxed”. We should also note the performance gap between winner and loser widened in 9 of 12 categories. Overall, the average gap rose from 59.1% in 2023 to 77.4% in 2024. This is strong evidence of decreased spending balance. Here are some more performance specifics:

  • Income – The winner & loser are new but expected. The gap stayed at 86% and is again below 100%.
  • # Earners – Winner & loser are new. The loser has a very low income. The gap widened from 39% to 84%.
  • Occupation – Blue Collar replaced Service Workers on bottom. The gap widened from 38% to 61%.
  • Age, Generation – Gen X is now on top in both and Gen Z on the bottom. Both gaps widened. Age:+42%; Gen:+28%
  • Race – The usual winner. African Americans replaced Asians on the bottom. The gap widened from 83% to 107%.
  • Education – Both are new but, like income, very expected. The gap increased from 35% to 76%.
  • Housing – Owning a home is always important. The usual winner & loser returned. The gap widened – 74% to 79%.
  • Area – The usual winner/loser – Rural on top & Center City on the bottom. The gap narrowed a little 82% to 79%.
  • Region – Both are new and this category also had a small decrease in the performance gap – 30% to 29%.
  • CU Comp, CU Size – Comp: No change. Size: 2 replaced 3. Both gaps widened. Comp: +24%; Size: +15%

It’s time to “Show you the money”. Here are segments with the biggest $ changes in Pet Food Spending.

There are no repeats from 2023 and 17 flipped from 1st to last or vice versa. Last year there were 4 repeats and 4 flips -much more turmoil in 2024. The Surprise winners were w/o Mtge, $40>49K, Asians, Associates, A/O and Center City. The surprising losers were Boomers, w/Mtge, Whites, BA/BS and Suburbs. Spending fell -12.0% as 82.3% of demographic segments spent less. (In 23, 87.5% spent more) Plus, there was no category where all segments had increases. (5 in 23) However, in 2024 in Area, all segments spent less. Here are the specifics:

  • Generation – Gen X flipped to the top, replacing Millennials. Boomers are the new loser.
    • Winner – Gen X – Pet Food Spending: $12.91B; Up $1.48B (+13.0%)                                   2023: Millennials
    • Loser – Baby Boomers – Pet Food Spending: $13.24B; Down $3.31B (-20.0%)                 2023: Gen X
    • Comment – Much of the 2020>21 Pet Food spending boom and bust was due to the Boomers. Gen X took over the top spot in 21 & 22. In 2023, they had the only spending decrease. Millennials edged out Boomers for the win. In 2024, Gen X had the only Food lift. BTW – Millennials were -$2.0B.
  • Housing – The winner and loser flipped.
    • Winner – Homeowners w/o Mtge – Food: $12.96B; Up $1.30B (+11.2%)                        2023: Homeowners w/Mtge
    • Loser – Homeowners w/Mtge – Food: $19.60B; Down $4.06B (-17.2%)                          2023: Homeowners w/o Mtge
    • Comment – Only Homeowners w/o Mtge spent more. Renters spent -$2.70B, -26.5% less. Like 2023, all changes were double digit %. However, all were positive in 2023. In 2024, that number fell to just 1.
  • Age – The Winner and loser both flipped but the result was not surprising.
    • Winner – 45>54 yrs – Pet Food Spending: $8.23B; Up $0.78B (+10.4%)                                2023: 65>74 yrs
    • Loser – 65>74 yrs – Pet Food Spending: $6.58B; Down $2.42B (-26.9%)                               2023: 45>54 yrs
    • Comment: Only 45>64 spent more while <45 and 65> spent less. The lift was driven by Gen Xers while Millennials & Boomers drove the drop. This spending pattern is the exact opposite of 2023.
  • CU Composition – The 2023 winner flipped to the bottom. The 2024 winner is new, but not surprising.
    • Winner – Married, Couple Only – Food: $12.66B; Up $0.65B (+5.4%)                                  2023: Singles
    • Loser – Singles – Food: $7.51B; Down $3.09B (-29.2%)                                                            2023: Single Parents
    • Comment – Only Married, Couple Only and those with a Child 18>, +$0.02B, spent more. All other CUs spent $4.7B less. Married, w/children were -$1.89B, but Singles had by far the biggest drop after their huge, +$2.96B, +38.8% increase in 2023.
  • # Earners – No Earner, Singles flipped to the bottom. No Earner, 2+ CUs replaced them on top.
    • Winner –– No Earner, 2+ CUs – Pet Food Spending: $4.88B; Up $0.60B (+14.1%)                 2023: No Earner, Single
    • Loser – No Earner, Single – Pet Food Spending: $2.55B; Down $2.12B (-45.5%)                   2023: 3+ Earners
    • Comment – No Earner, 2+ CUs had the only spending increase. No Earner CUs were at the top & bottom. All CUs with any workers spent less on Pet Food.
  • Income – Both the winner & loser flipped, and the winner is again a surprise.
    • Winner – $40>49K – Pet Food Spending: $2.66B; Up $0.56B (+26.5%)                                    2023: <$30K
    • Loser – <$30K – Pet Food Spending: $3.92B; Down $2.71B (-40.9%)                                        2023: $40 to $49K
    • Comment – Only the $40>49K & $70>99K groups spent more, +$1.09B. <$40K spent -$4.68B less, which was more than double the -$1.80 decrease by $100K>. All groups over $70K still have 100+% performance.
  • Race/Ethnic – Both the winner and loser from 2023 flipped.
    • Winner – Asians – Pet Food Spending: $1.49B; Up $0.55B (+58.4%)                                         2023: White, Not Hispanic
    • Loser – White, Not Hispanic – Pet Food Spending: $33.40B; Down -$2.94B (-8.1%)             2023: Asian
    • Comment – The U.S. is becoming more racially/ethnically diverse, especially with Hispanics & African Americans but White, Not Hispanics are by far the biggest spender in every Pet Segment. Only Asians spent more, but the Minorities were still -$3.53B, -38.5%.
  • Education – Both winner and loser flipped and are surprising.
    • Winner – Associate’s Degree – Food Spending: $4.55B; Up $0.54B (+13.4%)                       2023: BA/BS Degree
    • Loser – BA/BS Degree – Food Spending: $12.03B; Down $2.40B (-16.6%)                             2023: Associate’s Degree
    • Comment – Only Associate’s degrees and High School Grads with Some College spent more. The other <College groups were -$2.98B, -33.9%. Advanced Deg. were only -$0.75B, -6.8%, so College Grads were -$3.15B, -12.4%.
  • # in CU – 1 Person flipped to the bottom and was replaced on top by 2 People.
    • Winner – 2 People – Pet Food Spending: $16.89B; Up $0.43B (+2.6%)                                 2023: 1 Person
    • Loser– 1 Person– Pet Food Spending: $7.51B; Down $3.09B (-29.2%)                                 2023: 4 People
    • Comment: Only 2 People CUs spent more. Singles were the big loser, but 3 & 4 People CUs both spent -$1.3B less. In fact, 2+ CUs were -$2.37B, -6.8%. Only 2, 3 & 5+ People CUs perform above 100%.
  • Occupation – Both winner & loser are new. The Winner, All Other, Not listed includes Unemployed was surprising.
    • Winner – All Other, Not Listed – Pet Food Spending: $4.79B; Up $0.34B (+7.7%)                2023: Retired
    • Loser – Tech/Sls/Clerical – Pet Food Spending: $5.45B; Down $1.49B (-25.8%)                    2023: Mgrs/Professionals
    • Comment – Only A/O, Unemployed spent more. Self-employed were -$0.64B, -17.5%; Retirees were -$1.48B, -14.0% and All Wage & Salary Workers were -$3.68B, -13.7%.
  • Region – The South flipped from last to 1st and the Northeast replaced them on the bottom.
    • Winner – South – Pet Food Spending: $14.96B; Up $0.15B (+1.0%)                                            2023: West
    • Loser – Northeast – Pet Food Spending: $6.22B; Down $2.38B (-27.7%)                                   2023: South
    • Comment – Only the South spent more. The drop by the Midwest, -$2.37, was virtually equal to the Northeast.
  • Area Type – The Winner and Loser both flipped.
    • Winner – Center City – Pet Food Spending: $10.90B; Down $1.01B (-8.4%)                            2023: Suburbs;
    • Loser – Suburbs 2500> – Center City: $17.23B; Down $2.73B (-13.7%)                                    2023: Ctr City/Rural – Tie          
    • Comment – In an unusual situation, all segments spent less. In 2023 Center City tied for the bottom, despite a $1.86B lift. In 2024, they won with a -$1.01B drop. Rural was -$1.73B, -12.7%.

We’ve now seen the “winners” and “losers” in terms of increase/decrease in Pet Food Spending $ for 12 Demographic Categories. In 2020, very specific segments binge bought Pet Food. In 2021, their pets “ate up” the overstock so Pet Food spending fell. 2022>23 brought a new challenge, strong inflation. However, most of America remains firmly committed to high quality Pet Food. Super premium Food already had high prices, so income is still very important in Pet Food spending. The 2023 result was 87.5% of all demographic segments spent more which drove a record lift of $6.81B, +17.6% to $45.5B. 2024 was a different story. 82.3% of demographics spent less. The result was $40.04B in spending, -$5.46B, -12.0%. We have identified the winning segments in performance and $ increase but they were not alone. Not every good performer can be a winner. Some “hidden” segments should also be recognized for their performance. They don’t win an award, but they get…

HONORABLE MENTION

Because the drop was so widespread, the possible members of this group was very limited. With 5 different categories, the group was diverse. The lifts were small, under 10% with 4 under 4%. No young groups were included. The Gen X/Boomer 55>64 yr olds spent $0.23B more. The biggest % lift came from the urban  1>2.5M people group. They are the only <100% performer, which is unusual. The smaller urban area with 100>249K people also spent $0.10B more, not unexpected in Food. A college degree mattered less as HS Grads w/some college spent more. Marriage & children matter as those with a child 18> had a miniscule, +$0.02B lift. Income matters in Pet Food spending, but the below avg $70>99K group had the biggest increase, +$0.53B. However, we should note that 3 segments had above avg income and 3 were below  avg. The group is definitely diverse.

Summary

Pet Food has been ruled by trends over the years. The drop in 2018 due to the FDA grain free warning broke a 20 year pattern of 2 years up followed by 1 year of flat or declining sales. This trendy nature increased with the move to premium foods in 2004. The 2007 Melamine crisis resulted in a series of “waves” which became a tsunami with the introduction of Super Premium Foods. The 25 to 34 yr old Millennials were the first to “get on board” with Super Premium in the 2nd  half of 2014. In 2015, many more groups began to upgrade. The result was a $5.4B spending lift. These consumers were generally more educated with higher incomes. Unfortunately, they often paid for the upgrade by spending less in other segments. In 2016, spending dropped as many value shopped, especially online. They spent some of the $3B “saved” Food $ in other segments but not enough so Total Pet Spending was down -$0.46B. In 2017, due to a price competitive market, we got a deeper penetration of Super Premium. These upgraders were mostly middle-income and not college educated. The result was a $4.6B increase but this time there was no trading of segment $.

In 2018 we were “due” a small annual increase in Pet Food, but spending fell $2.26B in reaction to the FDA warning on grain free dog food. The big decrease came directly from the groups who had fueled the 2017 increase. In fact, 71% of the demographic groups with the biggest change in Pet Food $ switched from first to last or vice versa from 2017.

That brought us to 2019. The FDA warning was false, so Pet Parents returned to Super Premium or even pricier options. Supplement $ also grew as the health of their Pet Children remained the #1 priority. Pet Food $ grew $2.35B with 75% of demographic segments spending more. Income and related categories mattered more, and Pet Food Spending became less demographically balanced. In 2020 the Pandemic accelerated this trend. Fear of shortages led to binge buying and a $5.65B increase. This behavior was driven by very specific groups. This spending disparity was manifested in the fact that the performance of 8 of 10 big spending groups exceeded 120% while 49% of all segments spent less.

In 2021, the retail market strongly recovered but the turmoil in Pet Food continued. The 2020 binge buying didn’t increase usage, so Pet Food spending fell by $2.44B. Every segment with the biggest increase in 2020 had the biggest decrease in 2021. The resulting drop in $ hid the fact that 65% of all demographic segments spent more on Pet Food.

In 2022 the situation returned to a more normal, balanced pattern in spending. Pet Parents renewed their commitment to high quality food for their children. Despite strong inflation, 82% of demographic segments increased spending generating a $4.29B (+12.5%) lift and reaching a new record high of $38.69B – even exceeding the 2020 binge by $1.85B.

In 2023 inflation grew to +10.6%, but spending was +$6.81B, a record. The lift was widespread. In 5 categories, all spent more and overall,  87.5% of demographics increased spending. 2023 was also more balanced as only 3 big groups performed over 120% and the best/worst discrepancy fell from 73.5% to 59.1%. 2023 was a great year for Pet Food.

In 2024, inflation plummeted to 0.2%, but so did Pet Food spending, -$5.46B, -12.0% to $40.04B. They are now the 2nd largest segment, behind Veterinary. The drop was widespread as 82.3% of demographics spent less and in the Area category, all segments were down. Spending  was also less balanced, as 5 big groups performed over 120%, up from 3 and the best/worst performance discrepancy rose from 59.1% to 77.4%. 2024 was a bad year for Pet Food.

Finally – The Ultimate Pet Food Spending CU is 3 people – a married couple and 1 other adult. They are 45>54 yr-old Gen Xers, White, but not Hispanic. At least one has an Advanced Degree and both work in their own business. This generates an income of $200K>. They are still paying the mortgage on their house in a rural area <2500 in the West.

2024 Pet Products Spending was $63.95B – Where did it come from…?

We looked at the Total Pet Spending for 2024 and its key demographic sources. Now we’ll start drilling down into the data. The first stop in our journey of discovery will be Pet Products – Pet Food and Supplies. These are the industry segments that are most familiar to consumers. They are stocked in over 200,000 outlets, plus the internet. Every week over 19,900,000 households buy food and/or treats for their pet children. Pet Products accounted for $63.95B (53.8%) of the $118.87B in Total Pet $ in 2024. This was down -$4.57B (-6.7%) from the $68.52B that was spent in 2023. However, inflation in 2024 was only 0.2% so the “real” drop was -6.9%. Pet Food had a huge drop after the record increase in 2023. Supplies also has been on a spending rollercoaster. After falling in 2020, there was a record surge in 2021. Spending fell in 2022, but there were small lifts in both 2023 & 2024.

Overall, in 2024 Pet Food spending fell -$5.46B while Supplies spending increased $0.89B. We’ll combine the data and see where the bulk of Pet Products spending comes from.

We will follow the same methodology that we used in our Total Pet analysis. First, we will look at Pet Products Spending in terms of the 10 demographic category groups that were responsible for 60+% of Total Pet spending. Then we will look for the best and worst performing segments in each category and finally, the segments that generated the biggest dollar gains or losses in 2024.

The first chart details the biggest pet product spenders for each demographic category. It shows their share of CU’s, share of pet products spending and their spending performance (spending share/share of CU’s). All but 2 of the biggest spending groups are the same as Total Pet. To reach 60%, Education added Associates & Area replaced Center City with Rural. The categories are in the order that reflects their share of Total Pet Spending. This highlights a lot of differences. Only 1 is the same rank – Area, and the group is different. However, we should note that, like Total Pet Spending, Income is the highest performing demographic characteristic. In Pet Products there are only 4 groups with a performance rating of 120+%, the same as last year and 3 less than Total Pet in 2024. This reflects the fact that Pet Products spending, especially on Food, is spread more evenly across the category segments.

  1. Housing – Homeowners (80.8%) up from 77.9%. Controlling your “own space” has long been the key to pet ownership and more pet spending. Their performance rose from 119.7% to 124.4% but they stayed 4th in terms of importance for increased pet products spending. They are still in the 120% club but now without rounding up their performance. Only Homeowners w/o Mtge spent more on Pet Products in 2024, a strong $2.18B, +12.6% lift. The decrease for Renters was -$2.85B, -18.8% while the drop for Homeowners w/Mtge was -$3.90B, -10.8%. They only gained in share & performance because their -3.2% decrease was less than half of the national -6.7% drop.
  2. Race/Ethnic – White, not Hispanic (82.6%) up from 81.1%. They are the largest in spending share and account for 79+% of the spending in every segment. Their performance rose from 122.2% to 125.0% but they stayed 3rd in terms of importance in Pet Products Spending demographic characteristics. Only Asian Americans spent more, +35.2%. The biggest $ drop was -$2.72B by Whites but African Americans spent -$1.72B, -44.6% less. Minorities are 33.9% of U.S. CU’s, but they only spend 17.4% of Pet Products $, down from 18.9% in 2023 but up 35.9% from 12.8% in 2020. Pet ownership is relatively high in Hispanic households, but it is significantly lower for African Americans and Asians.
  3. Area – Suburban & Rural (73.1%) down from  73.4%, but their performance grew from 112.1% to 112.6%. Suburban CUs are the biggest product spenders but all areas spent over $1B less. Center City is still by far the worst performer but they had the smallest drop, -$1.05B, -5.8%. The performance lift was due to more Center City CUs.
  4. Income – Over $70K (68.8%, up from 64.7%). Pet Parenting is common in all income groups but money is a big driver in the spending for all industry segments. Plus, their performance rose to 131.5% from 128.2%, CU income continues to be the single most important factor in increased Pet Products Spending. As a rule, Income ↑= Pet Products Spending . 2024 didn’t always follow that rule. Only incomes $40>99K and $200K> spent more. $200K had the biggest $ lift, +$1.36B but $40>49K led in %, +15.2%. Biggest Drops: $<40K, -$4.86K; $150>199K, -$2.09B.
  5. # in CU – 2>4 people (70.2%) up from 67.1%. The share for Pet Products is lower than for Total Pet, 72.5%. However, If you put 2 people together, pets very likely will follow and you must spend money on food and supplies. Their 116.6% performance is up from 112.7%. Only 2 People CUs spent more, +$0.64B, +2.6%. The biggest drop was Singles, -$3.10B. This was the most important factor in the group’s share/performance lifts.
  6. Occupation – All Wage & Salary Earners (61.2%) down from 62.4%. Their performance also fell from 102.4% to 99.1%. Only Mgrs/Professionals and All Others (Unlisted) spent more. Mgr/Prof were +0.91B, +4.4%. Biggest Drops: Tech/Sls/Clerical, -$2.62B; Blue Collar, -$1.13B. The Wage & Salary group is no longer “earning their share”.
  7. Education – Assoc Degree> (69.5%) up from 66.5%. The performance of the expanded group also rose from 114.0% to 117.8%. However, Education fell from 5th to 7th in importance in Pet Products spending. The lifts in share & performance were due to widespread -$1B drops while Associates had a $0.54B increase. The only other lift was $0.13B by HS Grads  w/some college. The biggest drops were -$2.40B by BA/BS & -$1.88B by HS Grads.
  8. CU Composition – Married Couples (62.6%) up from 60.0%. Their performance rose from 127.8% to 130.5% but they stayed 2nd in importance. Only Married, with an Oldest Child 18> (+$0.77B) and Couples Only (+$0.21B) spent more. Share/Performance grew because Married were -$1.08B (-2.6%) while All Others were -$3.49B (-12.7%).
  9. # Earners – 2+ CU, 1 or 2 Earners (59.7%) up from 57.1%. Their performance is 119.2%, up from 113.7%. This group reinforces that income is a big driver but the # of earners is much less important. The lift in share and performance was due to their -$0.95B (-2.4%) drop being much less the -$3.62B (-12.3%) by other segments. 2 Earners had the biggest lift, +$0.70B (+2.7%). The only other increase was close, +$0.68B, (+11.3) by No Earner, 2+ CUs. Along with the biggest lift, the biggest drop was also in the big share group. The 1 Earner, 2+ CUs spent -$1.65B (-12.3%) less.
  10. Age – 35>64 (61.3%) up from 56.4%. Their performance also rose from 108.0% to 118.2%. Only 45>64 (Mostly Gen X) and 75+ had increases. All other age groups, but 35>44 (-$0.67B) spent over $1B less. The biggest drop was -$2.12B by 65>74. The biggest lift was +$0.66B (+5.1%) by 45>54 but 55>64 was a close second at +$0.57B.

For Pet Products, only the Education & Area spending groups are different than Total Pet, but there are other differences. Pet Products spending behavior was totally dominated by the big drop in Pet Food $. Money matters most for both but with only 4 members of the 120 Club, compared to 7 for Total Pet, Products spending is more balanced.

Now, let’s drill deeper and look at 2024’s best and worst performing Products spending segments in each category.

Most of the best and worst performers are the ones that we would expect. However, there are 10 that are different from 2023, the same as last year but 4 more than Total Pet this year. Changes from 2023 are “boxed”. We should note that only 2 of the Product winners are different from Total Pet. Down from 6 in 2023. With the big drop in Food, the spending behavior became more consistent.

The average performance of the 2024 Product winners was 133.5%, up from 130.4%. The average for the losers was 64.7%, up from 57.9% . The gap between best and worst grew from 65.7% to 75.9%, even above 75.4% in 2022. This indicates that Pet Products spending became less balanced across America in 2024. We should also note:

  • Generation, Age – Gen X replaced the Boomers on top. Gen Z (<25) fell to the bottom replacing Born <1946 (75+).
  • Education – Adv. Degree replaced BA/BS on top. <HS replaced HS Grads at the bottom. Education matters.
  • Income, # Earners – $200K> replaced $150>199K & 2 Earners replaced 3+ Earners, minor high income changes. The importance of income is reinforced in many categories like Age, Occupation and Education.
  • CU Composition – Married, Child 18> are back on top. All Married CUs but Child <6 perform at 100+%.
  • Race/Ethnic – White, Not Hispanic are the perennial winners. African Americans have the lowest income and low pet ownership. They replaced the high-income Asians, who are increasing pet ownership and spending.
  • Region – The West has high income and lots of space. They replaced the Midwest on top.
  • Occupation – Self-Employed has the highest income & are bosses. In 2023, They replaced Managers on top. Service Workers have the lowest income of any worker and often a difficult life. Stayed on bottom. No Surprise

It’s time to “Show you the money”. Here are segments with the biggest $ changes in Pet Products Spending.

Now, we’ll see who drove Pet Products spending down. There are no repeats from 2023, and 12 Segments flipped from first to last or vice versa. This is much more turmoil than 2023 which had 5 repeats but only 4 flips. Most of the winners are not surprising but in Area, all segments spent less. 2023 had 5 categories where all segments spent more. You see that the drops are much bigger. 78% of 96 demographics spent less. In 2023, 86% spent more. Here are the specifics:

  • Housing – The winner and loser flipped, and both had double digit % change.
    • Winner – Homeowner w/o Mtge – Products: $19.44B; Up $2.18B (+12.6%)             2023: Homeowner w/Mtge
    • Loser – Homeowner w/ Mtge – Products: $32.21B; Down $3.90B (-10.8%)                2023: Homeowner w/o Mtge
    • Comment– Renters were -$2.85B (-18.8%) and had the only drop in Supplies, -$0.15B.
  • Generation – Gen X flipped to the top and replaced Millennials.
    • Winner – Gen X – Products Spending: $20.81B; Up $1.66B (+8.7%)                               2023: Millennials
    • LoserBaby Boomers – Products Spending: $19.92B; Down $3.14B (-13.6%)            2023; Gen X
    • Comment – Gen X moved to the top after 2 annual drops. Only Gen X spent more on Food, +$1.66B. All but Gen Z, -$0.35B, had small lifts in Supplies. The biggest was +$0.48B, by Millennials.
  • Income – The loser and winner are both new, but very expected.
    • Winner – $200K> – Products Spending: $12.77B; Up $1.36B (+11.9%)                           2023: $30>39K
    • Loser – <$30K – Products Spending: $5.85B; Down $2. 74B (-31.9%)                               2023: $40>49K
    • Comment – A spending rollercoaster: <$40K = -$4.86B; $40>99K = $1.30B; $100>199K = -$3.08B; 200K> = $1.36B Food & Supplies Spending Matches: <$40K = Both Down; $70>99K = Both Up
  • Region– The South flipped to the top. Only they spent more on Food and they had the biggest lift in Supplies, $0.91B
    • Winner – South – Products Spending: $22.87B; Up $1.06B (+4.9%)                                2023: Northeast
    • Loser – Midwest – Products Spending: $13.86B; Down $3.28B (-19.1%)                         2023: South
    • Comment – All regions, but the South spent less but only the Midwest spent less on Supplies.
  • Occupation – Mgrs & Professionals flipped to the top and replaced Retirees.
    • Winner – Mgrs & Professionals – Products Spending: $21.48B; Up $0.91B (+4.4%)      2023: Retired
    • Loser – Tech/Sls/Clerical – Products Spending: $8.69B; Down $2.62B (-23.2%)             2023: Mgrs/Professionals
    • Comment – Only Managers/Professionals and All Other/Unemployed spent more but only A/O had a lift in Food. Mgrs were +$1.25B in Supplies, but 5 of 8 spent more. Tech/Sls/Cler had the biggest drops in Food & Supplies.
  • Education – BA/BS flipped to the bottom and were replaced on top by Advanced Degrees.
    • Winner – Advanced Degree – Products Spending: $17.48B; Up $0.89B (+5.4%)              2023: BA/BS Degree
    • Loser – BA/BS Degree – Products Spending: $19.80B; Down $1.96B (-9.0%)                    2023: Associate Degree
    • Comment – Only Adv. Degrees spent more. Less than HS Grads had the biggest % drop, -46.1%, while Associate Degrees were only down -0.9%. Overall, <College were -$3.50B, -11.6% and College Grads were -$1.07B, -2.8%
  • CU Composition – Singles flipped to the bottom, replacing Single Parents.
    • Winner – Married, Child 18> – Products: $7.46B; Up $0.77B (+11.6%)                               2023: Singles
    • Loser – Singles – Products: $11.85B; Down $3.10B (-20.8%)                                                   2023: Single Parents
    • Comment – Married, Oldest Child 18>, Married, Couple Only and 2+ Adults, No Kids were the only segments to spend more on Products, Food & Supplies. Overall, Married couples were down -2.6% in Products (Avg: -6.7%) They had a drop in Food & lift in Supplies. 24 was very bad for Singles. Prod: -20.8%; Food: -29.2%; Supp: -0.2%.
  • # Earners – Both the winner and loser are new, but only 2 segments spent more.
    • Winner – 2 Earners – Products Spending: $26.43B; Up $0.70B (+2.7%)                              2023: 1 Earner, Single
    • Loser – 1 Earner, 2+ CU – Products Spending: $11.75B; Down $1.65B (-12.3%)                   2023: 3+ Earners
    • Comment – While income matters most, the # of Earners is still not a major factor in Pet Products spending as 1 Earner segments won in 22/23. In 24, 2 Earners won in $, but No Earner, 2+ CUs had the biggest % lift, +11.3%.
  • Age – The 65>74 yr-olds flipped from first to last and were replaced on top by 45>54.
    • Winner – 45>54 yrs – Products Spending: $13.52B; Up $0.66B (+5.1%)                          2023: 65>74 yrs
    • Loser – 65>74 yrs – Products Spending: $10.01B; Down $2.12B (-17.5%)                          2023: 55>64 yrs
    • Comment: Only 45>64 & 75> had Product $ lifts. 45>64 spent more on Food. 55>64 & 75> spent more on Supplies. Only 55>64 spent more on both. 65>74 was +$2.35B on Food in 23 and -$2.42B in 24.
  • # in CU – 1 Person flipped to the bottom and was replaced on top by 2 People.
    • Winner – 2 People – Products Spending: $25.35B; Up $0.64B (+2.6%)                          2023: 1 Person
    • Loser – 1 Person – Products Spending: $11.85B; Down $3.10B (-20.8%)                        2023: 4 People
    • Comment: Only 2 People CUs had a lift in Products or Food. They were joined in Supplies by 4 People, +$0.94B.
  • Race/Ethnic – The 2023 winner & loser, White, Non-Hispanics and Asians both flipped.
    • Winner – Asian – Products Spending: $2.18B; Up $0.57B (+35.2%)                                             2023: White, Not Hispanic
    • Loser – White, Not Hispanic – Products Spending: $52.85B; Down $2.72B (-4.9%)               2023: Asian 
    • Comment – Only Asians spent more. African Americans were (-44.6%) and Hispanics (-9.2%). All but Asians spent -$1.2>$2.9B less on Food. Asians were +$0.55B. All had had lifts in Supplies spending. The biggest was +$0.48B by Hispanics. Asians had the smallest, only +$0.02B.
  • Area Type – Center City flipped to the top with the smallest drop. All spent less. In a good year, all often spend more
    • Winner – Center City – Products Spending: $17.19B; Down $1.05B (-5.8%)                  2023: Suburbs 2500>
    • Loser – Rural – Products Spending: $18.13B; Down $2.27B (-11.1%)                                2023: Center City
    • Comment – All spent less on Food. Only Suburbs spent more on Supplies, +$1.48B but their Food $ were -$2.73B.

We’ve now seen the winners and losers in terms of increase/decrease in Pet Products $ for 12 Demographic Categories. 2024 was not a good year for Pet Products Spending. Food $ fell -$5.46B after a record lift in 2023. Supplies spending had a Binge in 21, a Bust in 22, a $1.1B lift in 23 and a $0.89B increase in 24. The 2024 result was a -6.7% drop in which 78% of 96 demographic segments spent less on Pet Products, a radical change from 86% spending more in 2023. In 2024 the good performances were limited, but not every good performer can be a winner. Some of these “hidden” segments should be recognized for their outstanding effort. I’ve found 6. They don’t win an award, but they deserve…

Honorable Mention

Pet Products spending was down -$4.57B in 2024 from a $5.5B decrease in Food and a small lift in Supplies. The drop in Pet Products spending was widespread as 78% of 96 demographic segments spent less. Income was still the most important factor, and spending became a little less balanced. It was not easy to find members for our honorable mention group. Gen Z ended their 2-year Pet Products spending surge and were -28% in Product $. <$40K incomes were -$4.86B but the 3 groups in the $40>99K range had 6% lifts and earned Honorable Mention. No Earner, 2+CUs had an 11.3% increase in Product $ so they returned to the list. The number of Earners is definitely much less important than income. but so is being “the Boss”. The 55>64 yr-olds were down in Food & Supplies in 2023. In 2024, both flipped to positive. In 2024, Center City was down -$1.05B in Product Spending. The biggest drop was -$1.21B by cities with a population of 2.5>4.9M. The only size with an increase was 1>2.5M. The lift was small, but they made the list. Married, Couple Only are often high profile but not in 2024. A lift in Food overcame a drop in Supplies so they earned their spot. The drop in Pet Products spending was definitely widespread so there were fewer “heroes”, but we found them.

Summary

Pet Products spending has seen a lot of turmoil since 2015. Consumers upgraded to Super Premium Food and cut back on Supplies in 2015. In 2016 they value shopped for Food and Spent some of the saved money on Supplies. In 2017 availability and value increased so they spent $7B more. In 2018 the FDA warning on dog food caused many consumers to downgrade and new tariffs on Supplies flattened growth. Products $ fell -$1B. In 2019 Pet Food spending rebounded to a record level but higher prices in Supplies hit home. Supplies Spending fell $2.98. Pet Products $ fell -$0.64B.

2020 brought the COVID pandemic. Pet Parents binge bought Pet Food in the 1st half of the year. As Pet Parents focused on “needs”, discretionary Supplies $ dropped significantly. However, Pet Products spending still grew by $3.99B to $52B.

In 2021, the Food binge was not repeated so spending fell, but Pet Parents caught up on purchasing all the Supplies that they had postponed buying. The result was a record increase in Supplies and a $6.21B increase in Pet Products $.

2022 was more normal. Pet Food spending increased $4.29B, +12.5% & Supplies spending fell -7.8%, producing a $2.42B, +4.2% lift. Pet Products $ were $60.63B. The lift was widespread as 70% of demographics spent more. The $ moved towards their older members in the 45>54 yr-old age group. However, the youngsters also made their presence felt as Gen Z more than doubled their Pet Products spending. Spending also became more demographically balanced. The most visible feature of this change was in the big groups doing at least 60% of the dollars. In order to reach the 60% minimum, the Education group was downgraded from College Grads to those with an Associate’s Degree or more. However, the balancing act was not limited to Education. 10 of 12 categories narrowed the gap between their best and worst performing segments. Overall, the average gap narrowed from 92.3% in 2021 to 75.4% in 2022. It definitely improved

In 2023, Food had a record lift and Supplies $ rose 4.9%. The $7.89B (+13.0%) lift was widespread. 86% of demographics had increases. While Income remains the most important factor, Pet Products spending continued to become a little more balanced. Overall, the disparity between Best & Worst performers fell from 75.4% in 2022 to 65.7% in 2023. The gap narrowed in all but Area & Region. Gen Z’s growth continued, and they were joined by the 65>. 2023 was great.

2024 was a bad year for Pet Products. A $5.47B drop in Pet Food $ overwhelmed an $0.89B lift in Supplies to produce a 23>24 change of -$4.57B, -6.7% in Products. The drop was widespread as 78% of Demographic Segments spent less and spending became a little less balanced as the Best/Worst disparity rose to 75.7%.

Finally,… The “Ultimate” 2024 Pet Products Spending CU is 3 people, a married couple with a child 18>. They are Gen Xers in the 45>54 age range and are White, but not Hispanic. At least one has an Advanced College Degree. They own their own business and both work, producing a CU income of $200K>. They still have a mortgage on their house located in a Rural area with a population <2500 in the West.